How to set up holdout tests to evaluate prediction accuracy
Three holdout testing methods you can use to evaluate the accuracy of a model’s predictions.


See our complete guide: How Faraday validates predictions — and how you can too.
If you've ever used AI to make predictions, chances are you've asked yourself "How do I know these are . . . correct?" It's a fair question, and healthy skepticism is a critical component of any Responsible AI practice.
Luckily there are plenty of great options for confirming that the predictions you're getting are mostly right. First, a bit of background.
Prediction basics: How do AI models make predictions?
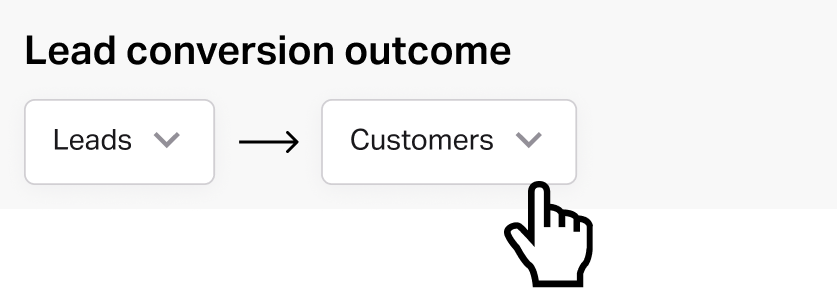
To set the stage, let's review how prediction works. Throughout this post, I'll use the example of a company wanting to predict which of its leads are most likely to "convert" (become a customer). In Faraday you'd represent this prediction objective with an outcome like so:
Finding patterns
Now we'll take you behind the scenes. To predict something, a system must comb through historical examples of that thing happening to find patterns.
Once you know the patterns, you can compare newly observed behavior to the crucial patterns that signal "true" - if they are similar, you predict "true," otherwise "false."
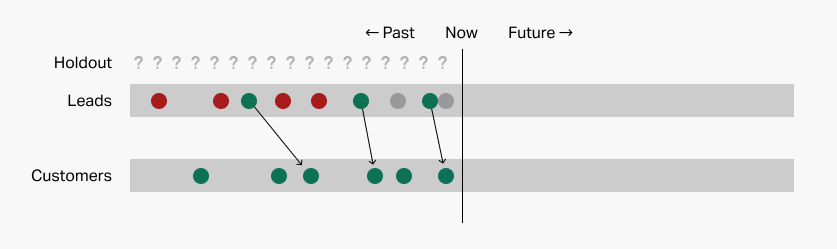
So, to follow our example, the first step is to pull together some historical lead data, including some leads that converted and some that didn't.
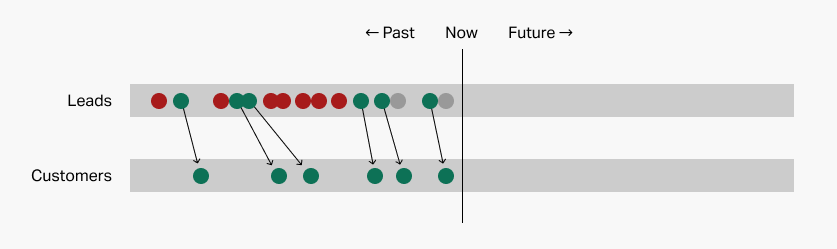
Here, the top row represents your leads over time at their first capture point. Some of them—the green dots—"convert" by becoming customers: we call these examples. Others—the red dots—go "stale" and represent failures: we call these counterexamples. It's too early to say what the few remaining gray dots will do, so we'll just ignore them.
One useful thing to note is that 6/13 of our leads converted, or about half the time. This will come in handy down the road.
Your prediction system will then use one of a variety of methods to look for interesting patterns. Is there something in common among the green leads? What about the red ones? How are they different? This identification of patterns (the model) is what lets the system make predictions about new leads.
Using patterns to make predictions
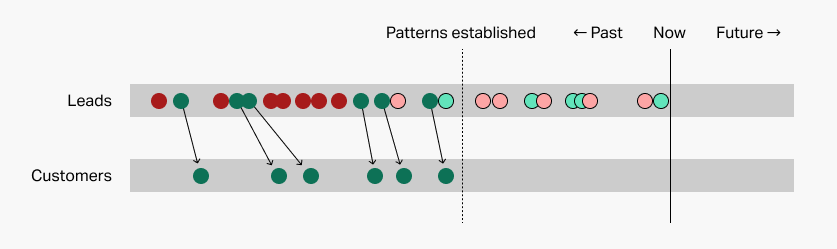
So now, let's take those pesky remaining gray dots, as well as some new ones that might have popped up since we figured out our patterns. I've put a dark border around them:
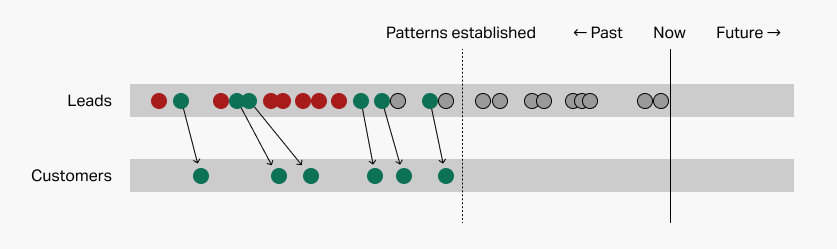
Your prediction system will scrutinize each of these possibilities to see which patterns in your list it follows. If it follows a lot of the patterns associated with conversion, the system will predict that it will convert. If it follows a lot of the patterns associated with non-conversion, the system will predict non-conversion.
Beware silly patterns
Easy, right? Too easy you might say. The reason to be skeptical here is that the patterns your prediction system found may be coincidences rather than reflect some underlying truth.
For example, your prediction system may say:
Here's a pattern I found! Leads with one of these exact email addresses convert, all others don't:
amy@example.com, leon@example.com, ..., pat@example.com
Sounds silly, but it happens all the time when the wrong kind of data is examined for patterns. The methods your prediction system uses aren't always clever enough to distinguish between goofy patterns and serious ones. Based on the data available, this pattern is actually incredibly powerful! In fact, it's 100% accurate.
Problem is, it will never work with any new leads, because they'll all have different email addresses and the system will therefore predict non-conversion for all of them.
Three holdout testing methods to see if your predictions are accurate
The way to avoid this kind of silliness is to "test" your patterns to see if they're right. If they pass the test, you can trust them going forward.
Think about your tests in school: your teacher asked you questions and you provided answers. Your teacher knew the true answers. If your answers matched the teacher's true answers, you got an A.
The hardest part of all this is that somebody has to "know" the "true" answers. If only we had some lead data where we knew the right answer . . .
But of course we do! We know which leads actually converted and which didn't. We just can't use the same data to both find patterns and put those patterns to the test.
There are a few great ways to split up your data for these two simultaneous purposes. They all rely on a "holdout"—setting aside a portion of the data to use exclusively for testing. This allows you to see whether the system "understands" enough to assess new data versus only being able to regurgitate answers for the questions it has already seen. Let's dive into these methods now.
Method 1: random holdout
Setup
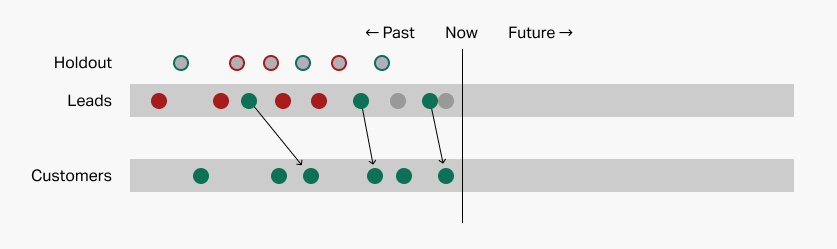
This is the most common approach, and it involves choosing a random subset of your historical data to set aside as a holdout. Only then do you use your prediction system to find patterns among the remaining data.

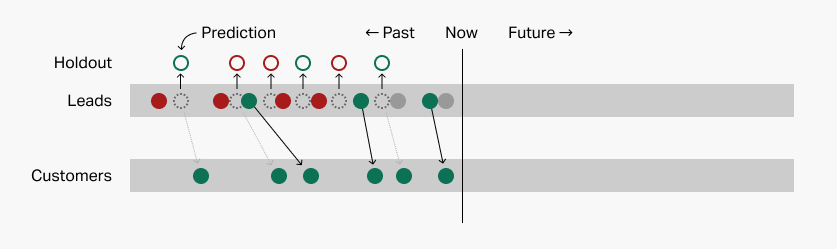
Here, we've used 50% of our data as a holdout. The system will find patterns exclusively among the remaining leads.
Testing
Now we're ready to "take the test." The leads in the holdout are the questions, and their true disposition (converted or not) is the answer key. But for the time being we pretend we don't have the answer key and we treat the holdout leads like new leads. What can the patterns we have tell us about these leads?
I'll illustrate those predictions with colored borders on the holdout leads:
Once we've used the patterns to make predictions about the holdout leads, we can dramatically reveal the answer key and see how accurate the patterns really are. Let's see how we did:
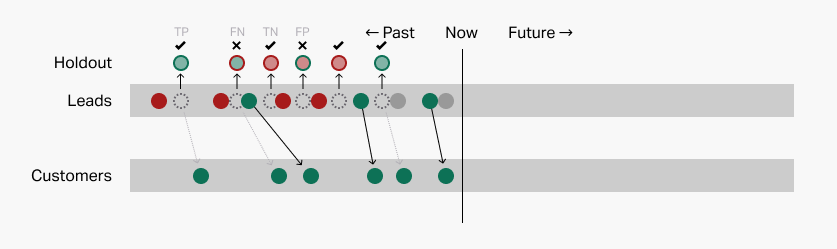
We got 4 right and 2 wrong for about 67% accuracy. Is that good or bad?
Evaluation
In real life you'll rarely get an A on this test. In some cases you'll predict conversion when the lead didn't actually convert (false positive). In other cases, you'll predict non-conversion when the lead did actually convert (false negative).
Recall that our actual lead conversion rate is about 50%. That means that a really dumb prediction system could always predict "convert" and get it right about 50% of the time, or flip a virtual coin and get the same result. By this measure, 67% is quite a bit better!
So assuming you got more right than wrong, it's an improvement. Before, your patterns were always right about your historical leads, but were useless for assessing new leads. Now, maybe your patterns aren't as perfect, but at least they're useful!
Conclusion
Finding the right balance between false positives and false negatives is part of the art of prediction and ultimately comes down to risk versus reward. It's out of scope for this post but I'll be writing one on that soon—subscribe below to get notified.
The upshot here is that the patterns the system found on the non-holdout leads appear to be effective in making predictions about the holdout leads. This is a very good sign that the patterns themselves are "real" and not based on silly coincidences.
The name for this approach is cross-validation. In practice, you actually perform this random holdout method multiple times to really make sure your patterns are real. The Faraday platform automatically uses 3 passes like this every time we look for patterns.
Method 2: recent holdout
Setup
Another approach is to use your most recent data as your holdout, a method called a backtest. As a refresher, here's what we started with:
To use this method, we temporarily "rewind" time to a previous day, like so:
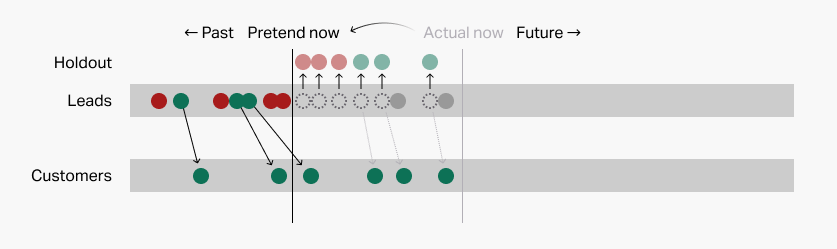
From here, the process is much like above. Our prediction system attempts to find patterns looking backwards from our "pretend now," ignoring the lead data that has transpired since then, which becomes the holdout.
Testing
Then it uses those "old" patterns to examine recent leads. Again, predictions here are represented by the colored borders on the holdout leads:
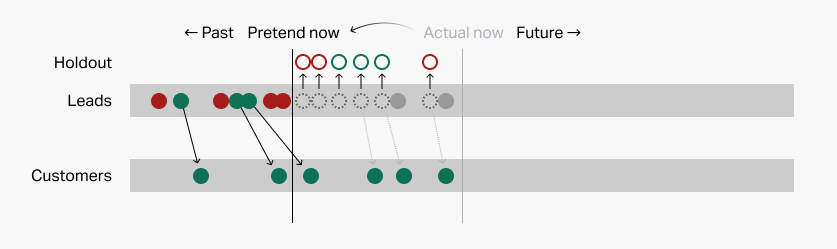
And finally we use our answer key to see how we did:
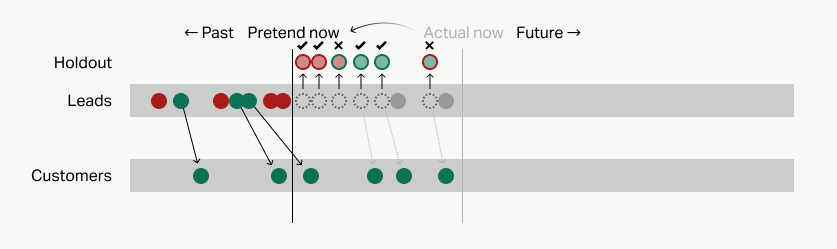
Evaluation
Here again, we went 4 for 6, or 67%. By the same logic as above, not bad.
The big advantage of the recent holdout versus the random holdout in my mind is that it's easier to understand and, ultimately, trust.
The main disadvantage of this type of holdout is the system can only look for patterns within data spanning a shorter period of time, so if the important patterns take time to appear, then using a recent holdout won't perform as well as using a random holdout.
Faraday has this feature built in as an additional option if you want it, although it's very compute-intensive so it's not available on all accounts by default. If you don't see it and want to use it, just ask support.
Method 3: secret holdout
You may hear other folks call this a blind holdout, although I hope to see the end of that ableist terminology soon.
The idea here is that you go to extreme lengths to hide your holdout from the prediction system—or even the company running the prediction system!—in order to boost your confidence even further.
Here, the principal doesn't even trust the teacher with the answer key! The diagram looks something like this:
The user has pre-emptively removed a random portion of the data to serve as the holdout and shared the remainder with the prediction system, which has no idea what's in the holdout.
The system finds patterns using all the data it has. Then the user performs the test by presenting the holdout leads to the system without their true dispositions. The system makes its predictions as usual:
The user then secretly compares these predictions to the "true" answer key to determine accuracy.
In practice the secret holdout is exactly the same as the random holdout, just a heck of a lot more complicated and time-consuming. Nevertheless, you could consider it if you don't trust your prediction system for one reason or another.
Faraday supports secret holdout testing. When connecting your data, make sure to remove your holdout first, so Faraday never sees it. Configure your account as usual. Then upload your holdout—minus disposition—as a CSV dataset with a holdout trait, create a matching Holdout cohort, and use it as a the population in a new pipeline. Add the outcome you want to test to the payload, and deploy an identified CSV target. Now match Faraday's predictions back to your original holdout and analyze to evaluate accuracy.
The real deal
Prediction systems finding silly patterns is a real problem—you could even say it's the problem of machine learning. Luckily there are lots of ways to avoid these kinds of shenanigans, and good prediction systems employ them automatically.
Behind the scenes, Faraday runs random and/or recent holdout testing constantly to confirm it's finding legitimate patterns that are practically useful going forward.
I know all this (I helped build the system!), but I still treasure my ongoing skepticism, and you should too. Hopefully understanding how pattern validation works, and seeing how it operates behind the scenes, will help you develop a careful confidence in the predictions you build your workflows around.
Andy Rossmeissl
Andy Rossmeissl is Faraday’s CEO and leads the product team in building the world’s leading context platform. An expert in the application of data analysis and machine learning to difficult business challenges, Andy has been running technology startups for almost 20 years. He attended Middlebury College and lives with his wife in Vermont where he lifts weights, makes music, and plays Magic: the Gathering.

Ready for easy AI?
Skip the ML struggle and focus on your downstream application. We have built-in demographic data so you can get started with just your PII.