Just launched: the Faraday Predictor Leaderboard
The Faraday Predictor Leaderboard offers a live, filterable view into the traits driving the most predictive lift across industries—giving you a real-time peek into what’s working in AI-powered marketing today.


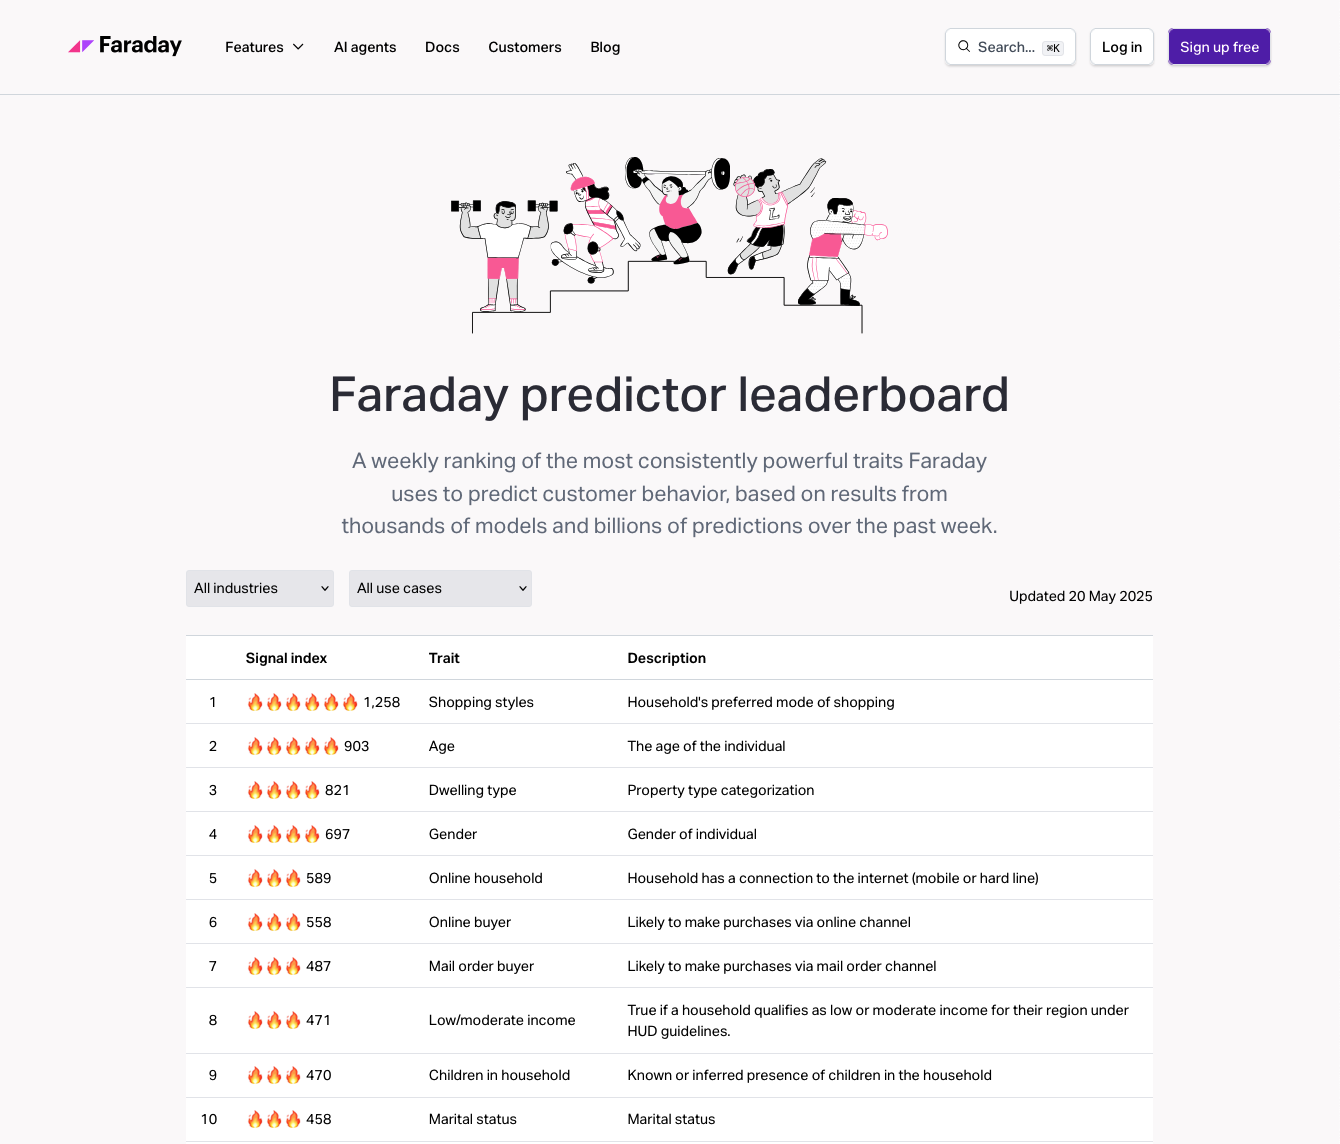
We just launched something we’re really excited about: the Faraday Predictor Leaderboard. It’s a live look at the most consistently predictive traits in our platform, based on thousands of AI models and billions of real-world events.
You can filter by industry and use case, so whether you're in solar or e-commerce, doing lead scoring or churn prevention, you see what relevant-to-you traits are driving results, today. Things like “recent mortgage inquiry” or “owns a pool” aren’t just trivia—they’re signals that real models are using to generate lift.
In other words: the leaderboard gives you a peek at what’s driving value across the Faraday predictive universe, in real time.
And the takeaway? You don’t have to guess what traits matter anymore. The leaderboard shows you what’s working right now—so you can shortcut the discovery process and zero in on the signals that are already driving lift across industries like yours.
How the Signal Index works
When you look at the leaderboard, the first thing you likely notice is the signal index. After all, it is the first column, but what exactly does that mean?
Each trait on the leaderboard is assigned a signal index—a relative measure of how often it appears as an important predictor across thousands of live Faraday models. It’s not a raw number or percentage, but a way of showing which signals are standing out right now compared to others. This approach, sometimes called "indexing," is common in benchmarking and lets us highlight what’s rising to the top across industries and use cases.
It all starts with FIG
Behind the scenes of the Predictor Leaderboard is one of the most powerful engines at Faraday: the Faraday Identity Graph (FIG). FIG is our proprietary graph of nearly the entire U.S. adult population, connecting thousands of behavioral, demographic, and life event traits to real individuals. It’s how we detect stable, predictive signals that drive meaningful outcomes—like improving retention in financial services, increasing acquisition in solar, or boosting reactivation in e-commerce.
So what exactly is a "trait"?
At Faraday, a trait is a specific detail about a person that helps explain their behavior—things like whether they’ve recently moved, have kids at home, or use a certain kind of credit card. When our models spot consistent patterns between these traits and real-world outcomes, they become powerful predictors of what someone might do next.
The traits on the leaderboard aren’t just interesting facts, they’re there because they’ve proven, across live campaigns, to consistently drive results. They help our models understand not just what someone did, but who they are and what matters to them.
So while the leaderboard gives you a snapshot of what’s working today, it also reveals the deeper, often surprising, behavioral signals powering our predictions.
How to use the leaderboard
Think of the Predictor Leaderboard as a window into how Faraday models actually work.
It’s not a tool for tweaking models or choosing traits—in fact, all Faraday deployments already include built-in explainability, so users can see what’s driving predictions in their own campaigns. Instead, the leaderboard is a live demonstration of the kinds of traits that consistently drive predictive lift across industries and use cases.
If you're considering using Faraday, it gives you a real-world preview of the kinds of signals our models uncover—like how “dwelling type” shows up in solar acquisition, or how “shopping style” influences reactivation in e-commerce.
You’re not picking traits. But you are seeing what matters—and that insight can inform how you think about your audience, your positioning, and the outcomes you want to drive.
So what’s trending this week?
Here are the top 5 traits currently driving predictions across Faraday:
-
Shopping styles 🛍 How a household prefers to shop (online, in-store, catalog, etc.). This trait is dominating campaigns that aim to personalize outreach based on behavior—especially in e-commerce and omni-channel retail.
-
Age 🎂 Simple but powerful, age is still one of the strongest predictors of conversion, churn, and reactivation, across almost every industry.
-
Dwelling type 🏡 Is it a single-family home? An apartment? A duplex? This trait is crucial for verticals like solar and insurance, where property type impacts eligibility and likelihood to act.
-
Gender ⚧ When used thoughtfully, this trait helps tailor messaging and product recommendations, especially in health, wellness, and fashion.
-
Online household 🌐 Does the household have a reliable internet connection? This trait is extremely predictive for digital product adoption and campaign engagement in rural and suburban markets.
Right now, these traits are being used to improve conversion rates, suppress churn, and drive smarter acquisition. That’s what the leaderboard shows: what’s working, right now, across real businesses and real campaigns.
Iteration is the key
The leaderboard isn’t static—and that’s the point. Traits rise and fall, and we track those shifts obsessively. Not just because it’s interesting, but because it’s essential.
Getting prediction right isn’t about one great model—it’s about improving with every pass. That’s why we monitor trends over time, ask what’s changing and why, and use those insights to refine how our models learn.
This is core to how Faraday works: persistent observation, rigorous iteration, constant tuning. The result? Smarter campaigns, sharper targeting, and better results for our customers—week over week.
Want to see what traits are trending this week? Check out the leaderboard!
Ben Rose
Ben Rose is a Growth Marketing Manager at Faraday, where he focuses on turning the company’s work with data and consumer behavior into clear stories and the systems that support them at scale. With a diverse background ranging from Theatrical and Architectural design to Art Direction, Ben brings a unique "design-thinking" approach to growth marketing. When he isn’t optimizing workflows or writing content, he’s likely composing electronic music or hiking in the back country.

Ready for easy AI?
Skip the ML struggle and focus on your downstream application. We have built-in demographic data so you can get started with just your PII.