What's new: dependency visualization and sortable list columns
Explore the latest Faraday updates with a visualization of how resources interact with each other, and new sortable list columns.


Let's take a look at some of the latest features in Faraday.
Dependency visualization
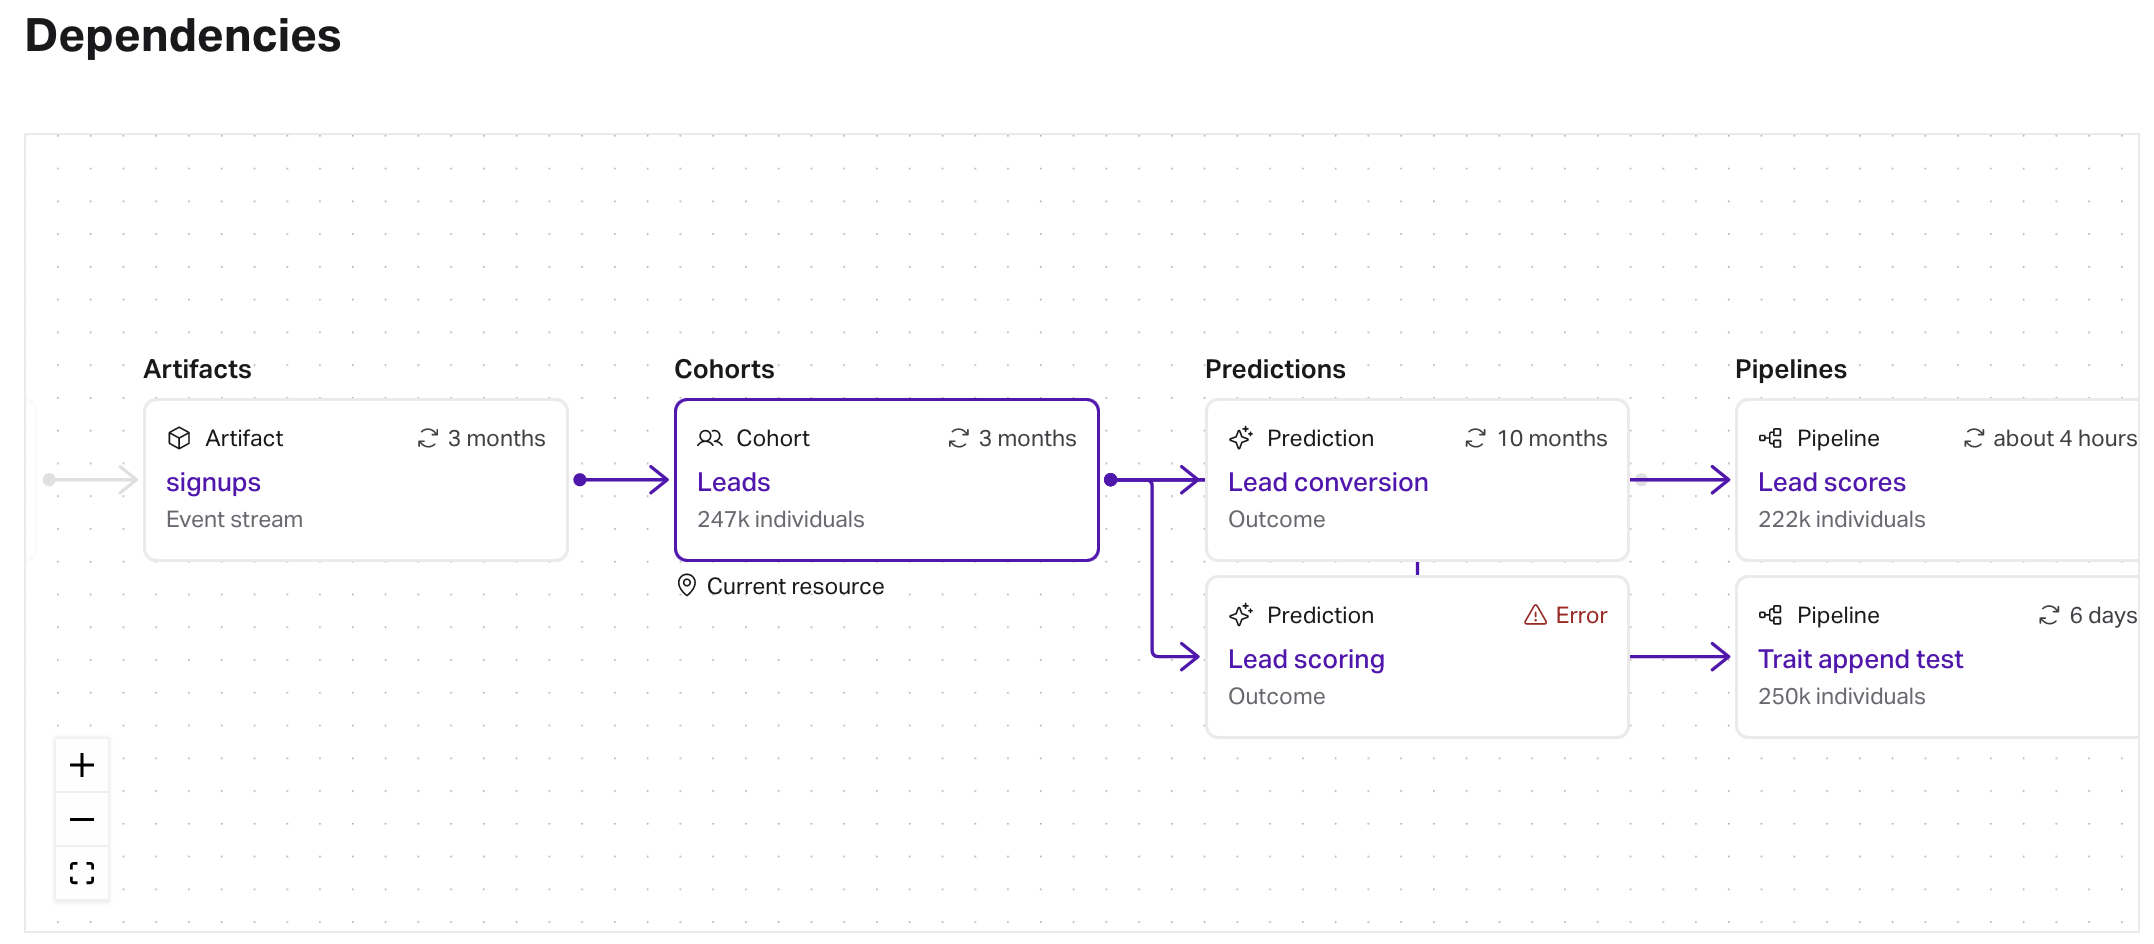
In Faraday, any given resource can be connected to one or more other resources, which we call dependencies. For example, a cohort you’ve built might be used to define an outcome, which is then used in a pipeline. This type of interconnectedness can make it difficult to troubleshoot issues, to see what impact editing a resource might have on other resources, and so on.
We’ve found that it can be helpful to zoom out and look at the bigger picture of where a resource fits in the larger picture of your Faraday account. To achieve this, we’ve added a dependency visualization to every resource’s detail page in the Dashboard.
The dependency visualization reveals the overall layout of resources in your Faraday account, and highlights which individual resources are connected to the one you’re currently viewing. In the above example, a signups event stream was used to define the leads cohort, which was used to define the lead conversion outcome.
This new visualization should help you understand which resources are necessary for your predictions, and which you can safely archive or remove.
Sortable date columns
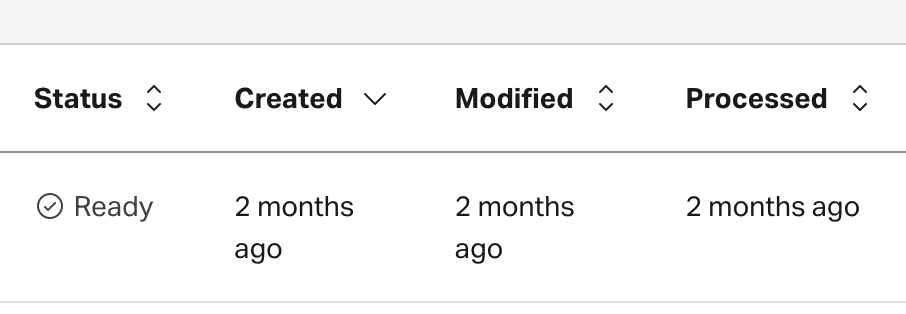
In the past, resources you created in Faraday were sorted alphabetically by name. While alphabetical sort is simple to understand and use, we found it a bit awkward to create something only to have it be dropped into the middle of a list. To improve this workflow, we’ve made the majority of columns sortable, and added new columns for relevant date information.
The created date is–you guessed it–the date that the resource was created. Modified refers to the date that the resource’s configuration was last modified (e.g. a trait was added to a cohort’s definition). Lastly, processed is the last time the output was processed by Faraday (i.e. the output changed).
Check out our changelog for a dated list of updates.

Faraday
Faraday is a predictive data layer that helps brands and platforms understand who their customers are and what they’re likely to do next. We connect first-party data with privacy-safe U.S. consumer context from the Faraday Identity Graph and deliver production-ready predictions and datapoints you can activate across marketing, sales, and customer journeys.

Ready for easy AI?
Skip the ML struggle and focus on your downstream application. We have built-in demographic data so you can get started with just your PII.

