Faraday model reports: Understanding feature importance and directionality
Learn how to analyze your predictive models to deeper understand your customer base.


Predictions are complex, and consumer predictions for marketing aren’t an exception. In many cases, you might find yourself given the green or red light to go after a lead, prevent a churn, or approach a customer in another way that’s specific to a business goal your org has. Having access to that knowledge is great, but it’s a black box–simply knowing whether or not a lead will bite isn’t enough if you want to truly understand your customers and the actions they take.
In Faraday, every predictive model you create for your business is scored based on how well you can expect the model to perform, and includes a full technical report describing how the model was built. While the full technical report includes a swathe of info for data science-minded users, for the sake of this guide we’re going to take a look at how features of importance and directionality impact a sample lead conversion model, which you can find in every outcome and recommender.
Features of importance
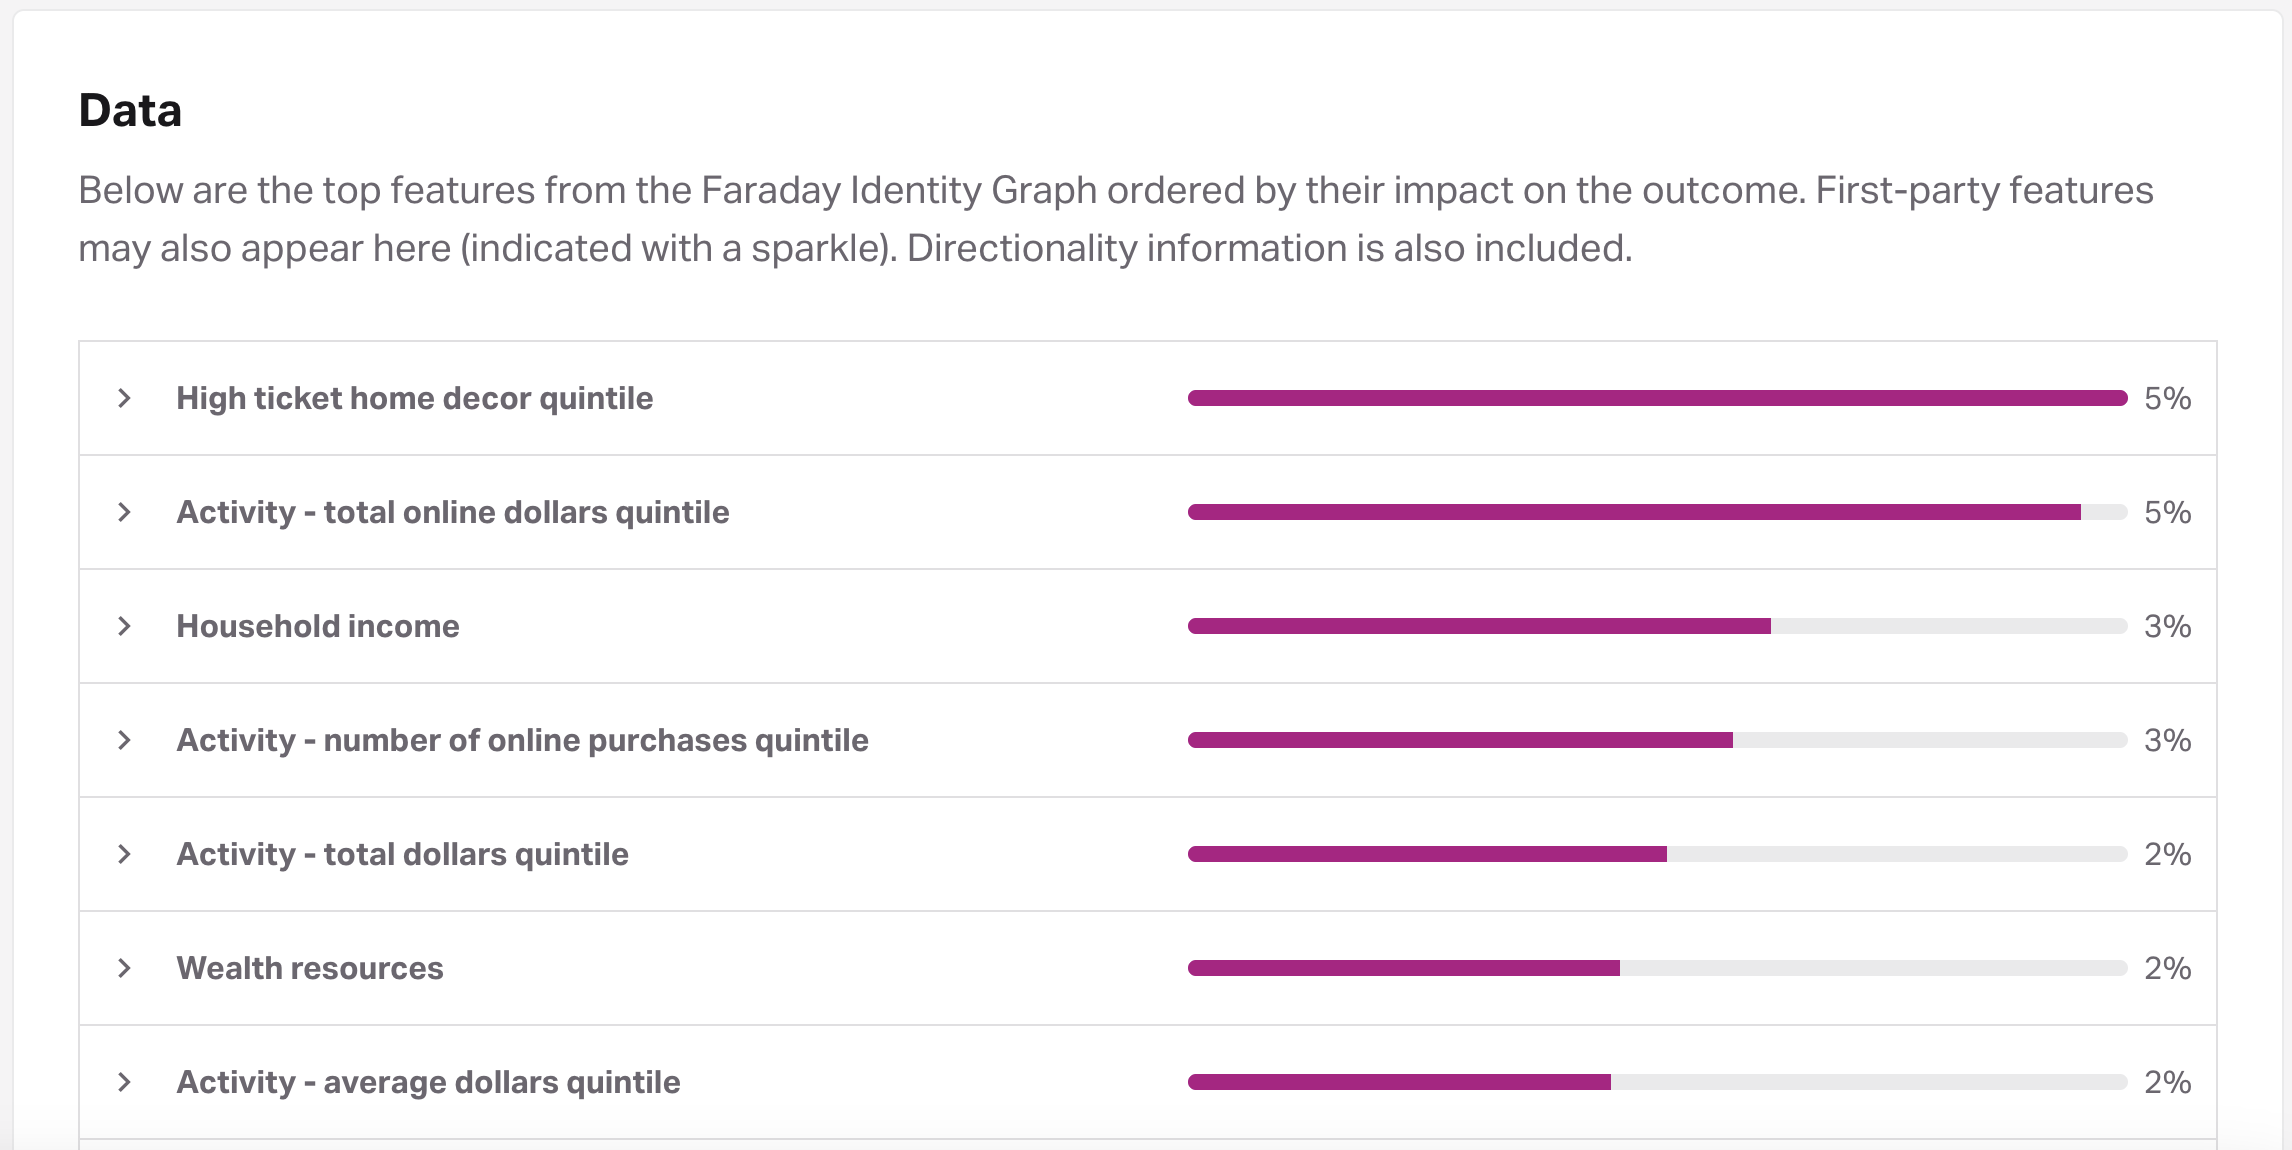
In each outcome and recommender, you’ll find a data section describing the top features of importance for that model broken down into tenures, or how long an individual existed within the eligibility cohort before entering the attainment cohort. The features that had the most impact in creating the model are listed in the chart, sorted by the level of impact. In the above image, you can see that features such as high ticket home decor quintile, activity, total online dollars quintile, and household income had a major impact on the model. This means that when thinking about who you’re targeting with these predictions, you can tailor creative and messaging appropriately–but that still feels a little broad. Let’s take a look at directionality to see exactly how these features of importance break down.
Directionality
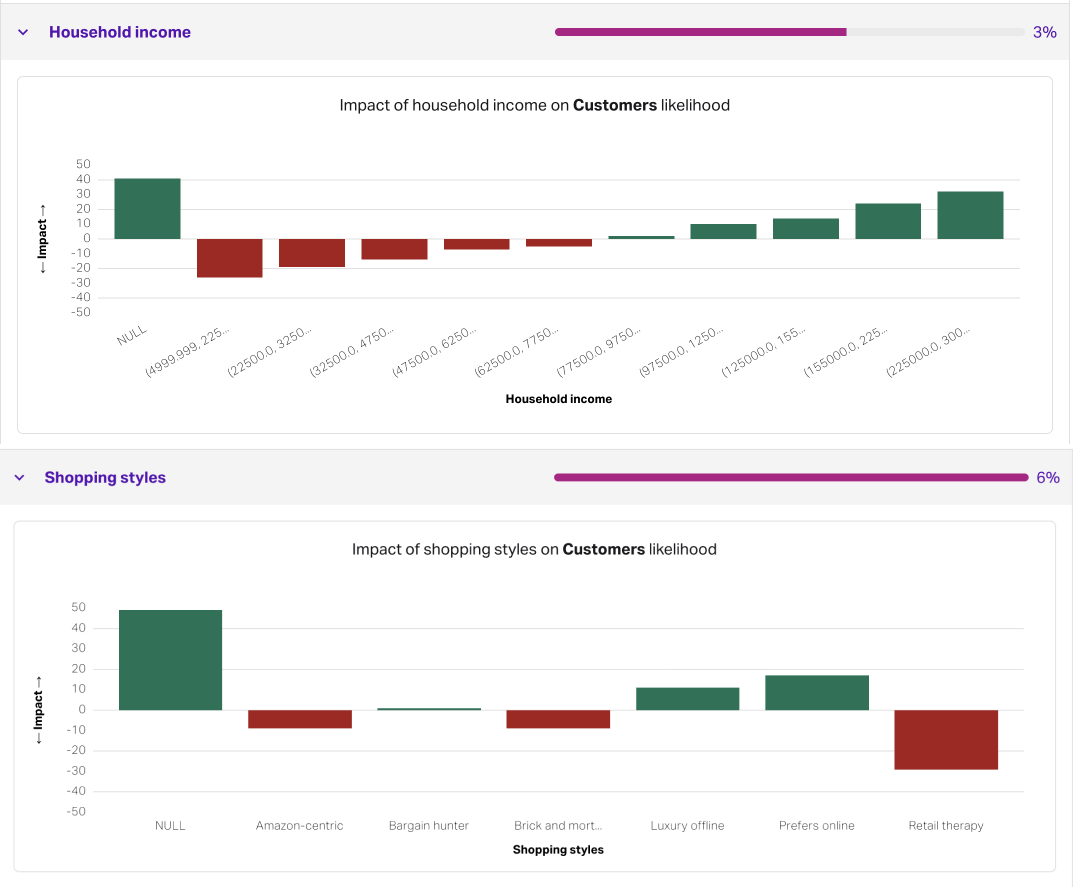
When you take a deeper look at a feature of importance in feature directionality, you’ll find it broken down into ranges if the feature is numeric, or selections if not. In the above example, green indicates positive, and red negative. For household income (HHI), it’s clear that consumers with an HHI of over 75k rank higher on average (green), whereas all HHI ranges lower than 75k rank lower (red). For shopping styles, luxury offline and prefers online shoppers rank higher, while retail therapy shoppers rank lower.
That’s cool and all, but what’s the takeaway?
In short, these breakdowns tell you that in this lead conversion model, the people that are most likely to convert are largely making more than 75k/yr, and prefer to shop online unless it's for luxury items. Using this info, your marketing to them can confidently personalize toward the positive features so that your content is relevant.
Andy Rossmeissl
Andy Rossmeissl is Faraday’s CEO and leads the product team in building the world’s leading context platform. An expert in the application of data analysis and machine learning to difficult business challenges, Andy has been running technology startups for almost 20 years. He attended Middlebury College and lives with his wife in Vermont where he lifts weights, makes music, and plays Magic: the Gathering.

Ready for easy AI?
Skip the ML struggle and focus on your downstream application. We have built-in demographic data so you can get started with just your PII.