Bottom up market sizing: how to calculate market size using predictive analytics
What is bottom up market sizing? What are its benefits? How can B2C brands accurately analyze markets without investing vast resources?


What is market sizing?
Market sizing is a method of calculating a company’s revenue potential in a geographic market, which can provide crucial insights for competitive brands to be aware of when looking to expand, otherwise resources are likely to be wasted.
Market sizing is not a new concept, but more recent innovations in data collection and predictive analytics solutions have opened the door for more accurate market size calculations, enabling brands to make better go-to-market decisions and expand with more confidence and direction than before.
Top down vs bottom up market sizing analysis
There are two methods of market sizing analysis: top down, and bottom up. In this article, we’ll look at both, and then explore how using predictive analytics for bottom up market sizing can provide you more accurate estimates while drastically expediting the analysis process, and give you actionable insight into where you’re most likely to have success penetrating.
Top down market sizing
When using top down market sizing to calculate your market potential, you start at the highest level of the market that you’re in, where you find the largest possible size of the market you could acquire, then multiply it by the percent of the market that your product fits in.
For example, say you’re a brand that sells humidifiers, and you’re planning to launch a new humidifier that’s perfect for maintaining moisture levels in a newborn’s nursery. With the top down approach, your research shows you that the US market for humidifiers is $700 million, and 65% of humidifiers sold annually are single-room, like your new product.
$700m X 65% = $455m
Since, for the most part, the numbers that are relevant to your company and industry are likely already published elsewhere, this approach involves doing some research to find the populations and market values you need rather than calculating them yourself.
Pros:
- It’s fast. The research involved and the calculation are both straightforward and quick, so there’s not much time investment in a top-level market size estimate.
- Accessible data. Regardless of the outlet you want to source your data from, people have been publishing industry reports and analyses for years, so the data you need can easily be found via some time on Google.
- Helpful at-a-glance. Since top down market sizing looks at broad trends and market-wide data, it’s useful to be able to know, at a glance, if the space you’re looking to go-to-market in is worth the investment you’d have to make.
Cons:
- It’s very broad. As mentioned above, it’s useful to run a top down market size analysis for an initial glance at the market, but it’s unlikely to be specific enough for your company’s needs.
Bottom up market sizing
Bottom up market sizing starts on the opposite end in that it begins with your niche. Using the same humidifier example, you’ll likely want to find people with children in the household to target since your new humidifier is for nurseries.
Through extensive research, data collection, and surveys, you find that there are 4 million people in this target group. To calculate the bottom up market size, you’d then multiply the number of people by the annual revenue you’d expect from them for the product–your customers are unlikely to buy more than one humidifier in a year, and its cost is $100 per unit, so we’ll use $100.
4 million people X $100 = $400m
So what’s the verdict? Top down or bottom up market sizing? Since it uses data that’s relevant to your company, bottom up market sizing provides a more accurate estimate of your potential market–if your company has the bandwidth to put in the time. Fortunately, predictive analytics can help cut down that long timeline dramatically while providing you with geographies where your most likely buyers live.
Pros:
- Backed by your data. Since bottom up market sizing uses your own data & analytics through your customers, product, and cost data, results are much more tailored to your company, and they’re more realistic to boot.
- As niche as you want it. Rather than relying on industry-wide assumptions, this strategy begins and ends with your company’s niche.
Cons:
- Time-intensive. Performing the data collection required to accurately run a bottom up market sizing analysis is a long process in that, whether you’re conducting interviews or surveys, you’ll need to wait for results to come in.
- Resource-intensive. Assigning teams to create surveys, conduct interviews, act on their results, and so on can occupy a significant portion of their time.
Calculating market size with predictive analytics
In the end, bottom up market sizing wins out as a more effective approach to calculate market potential. The downsides, of course, are the longer timeline and additional resources required to do it effectively.
This is where predictive analytics comes in–leveraging machine learning to predict individuals’ propensity to buy your products or services. With machine learning, your time-to-value in performing a bottom up market sizing analysis is dramatically reduced because it eliminates the need to design surveys and conduct interviews, conduct research, and wait for results.
Better yet, rather than spending extra time using your analysis to plan where you think your campaigns will have the most impact, likely buyer scores show you exactly where your high-intent buyers are at any geographic zoom that suits your needs.
Traditional approach to bottom up market sizing
As we reviewed earlier, the typical traditional approach involves multiplying the number of people in the segment by the annual cost of your humidifier, which is simple enough math once you’ve done the required research to find the number of people in the segment.
At the end of the day, there’s still a lot of guesswork involved. In your research, you uncovered the raw number of potential buyers in your market, but the only direction you might have as for where to direct your campaign are surveys, which are unlikely to have reliable penetration for guidance, and assumptions–maybe the 5 driest states in the U.S. are the best bets to market your humidifier?
Predictive approach to bottom up market sizing
With the predictive approach, you’ll take the segment you created above, then use AI to predict the propensity to buy for everyone in the segment based on real historical data. Machine learning algorithms surface patterns in the data to calculate just how likely each individual in this segment is to buy the product in likely buyer scores, and their forecasted spend over their lifetime as a customer of yours.
These likely buyer scores can be filtered by county, state, city, or metro, so that you have crystal clear indicators where your high-intent buyers are. You can even use your own points-of-interest, like brick and mortar locations, to perform radius-based likely buyer targeting for pin-point accuracy.
With Faraday, the predictive approach can be done in just a few clicks, saving you a significant amount of time and resources, providing more accurate results, and helping align your strategy through clear indicators for the locations you’ll have the highest likelihood of penetration in.
How to do bottom up market sizing with Faraday
Using Faraday, the predictive approach for bottom up market sizing can be embedded wherever in your stack you need it in less than a day. No developers, no data scientists, and no long research timeline required.
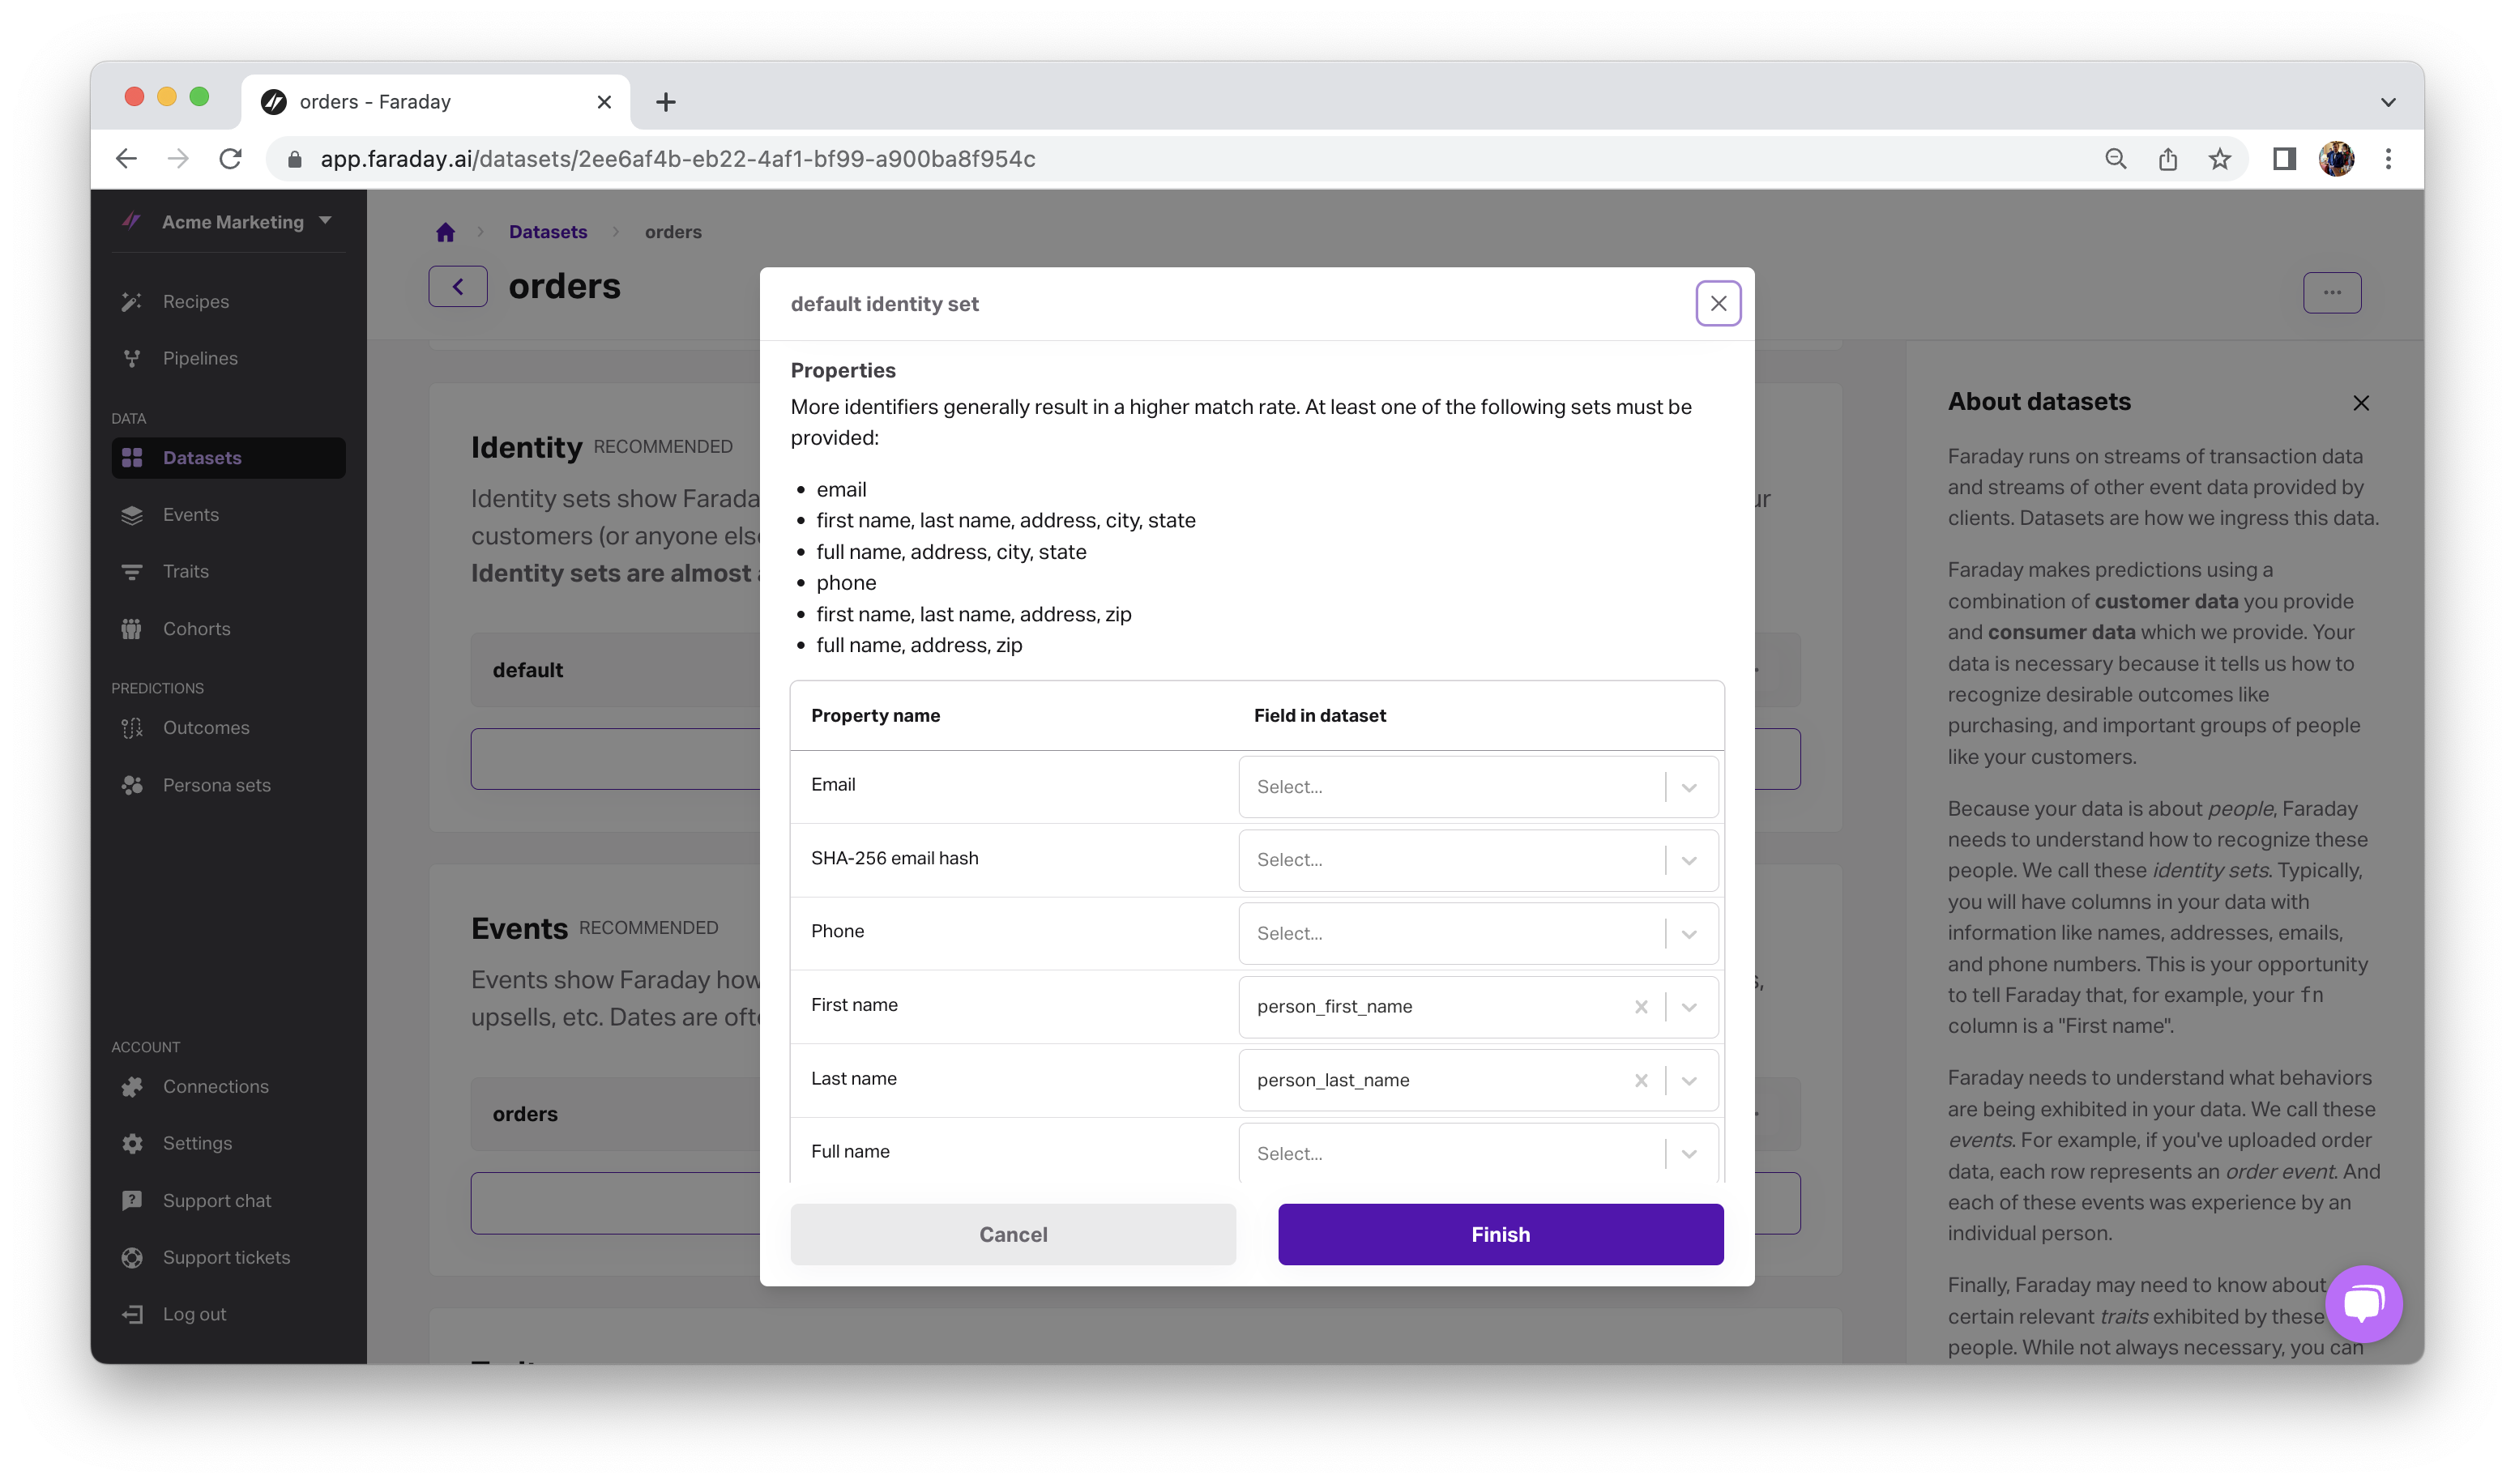
Connect data and define customers
To start, you plug in your data by mapping your data fields to Faraday properties.
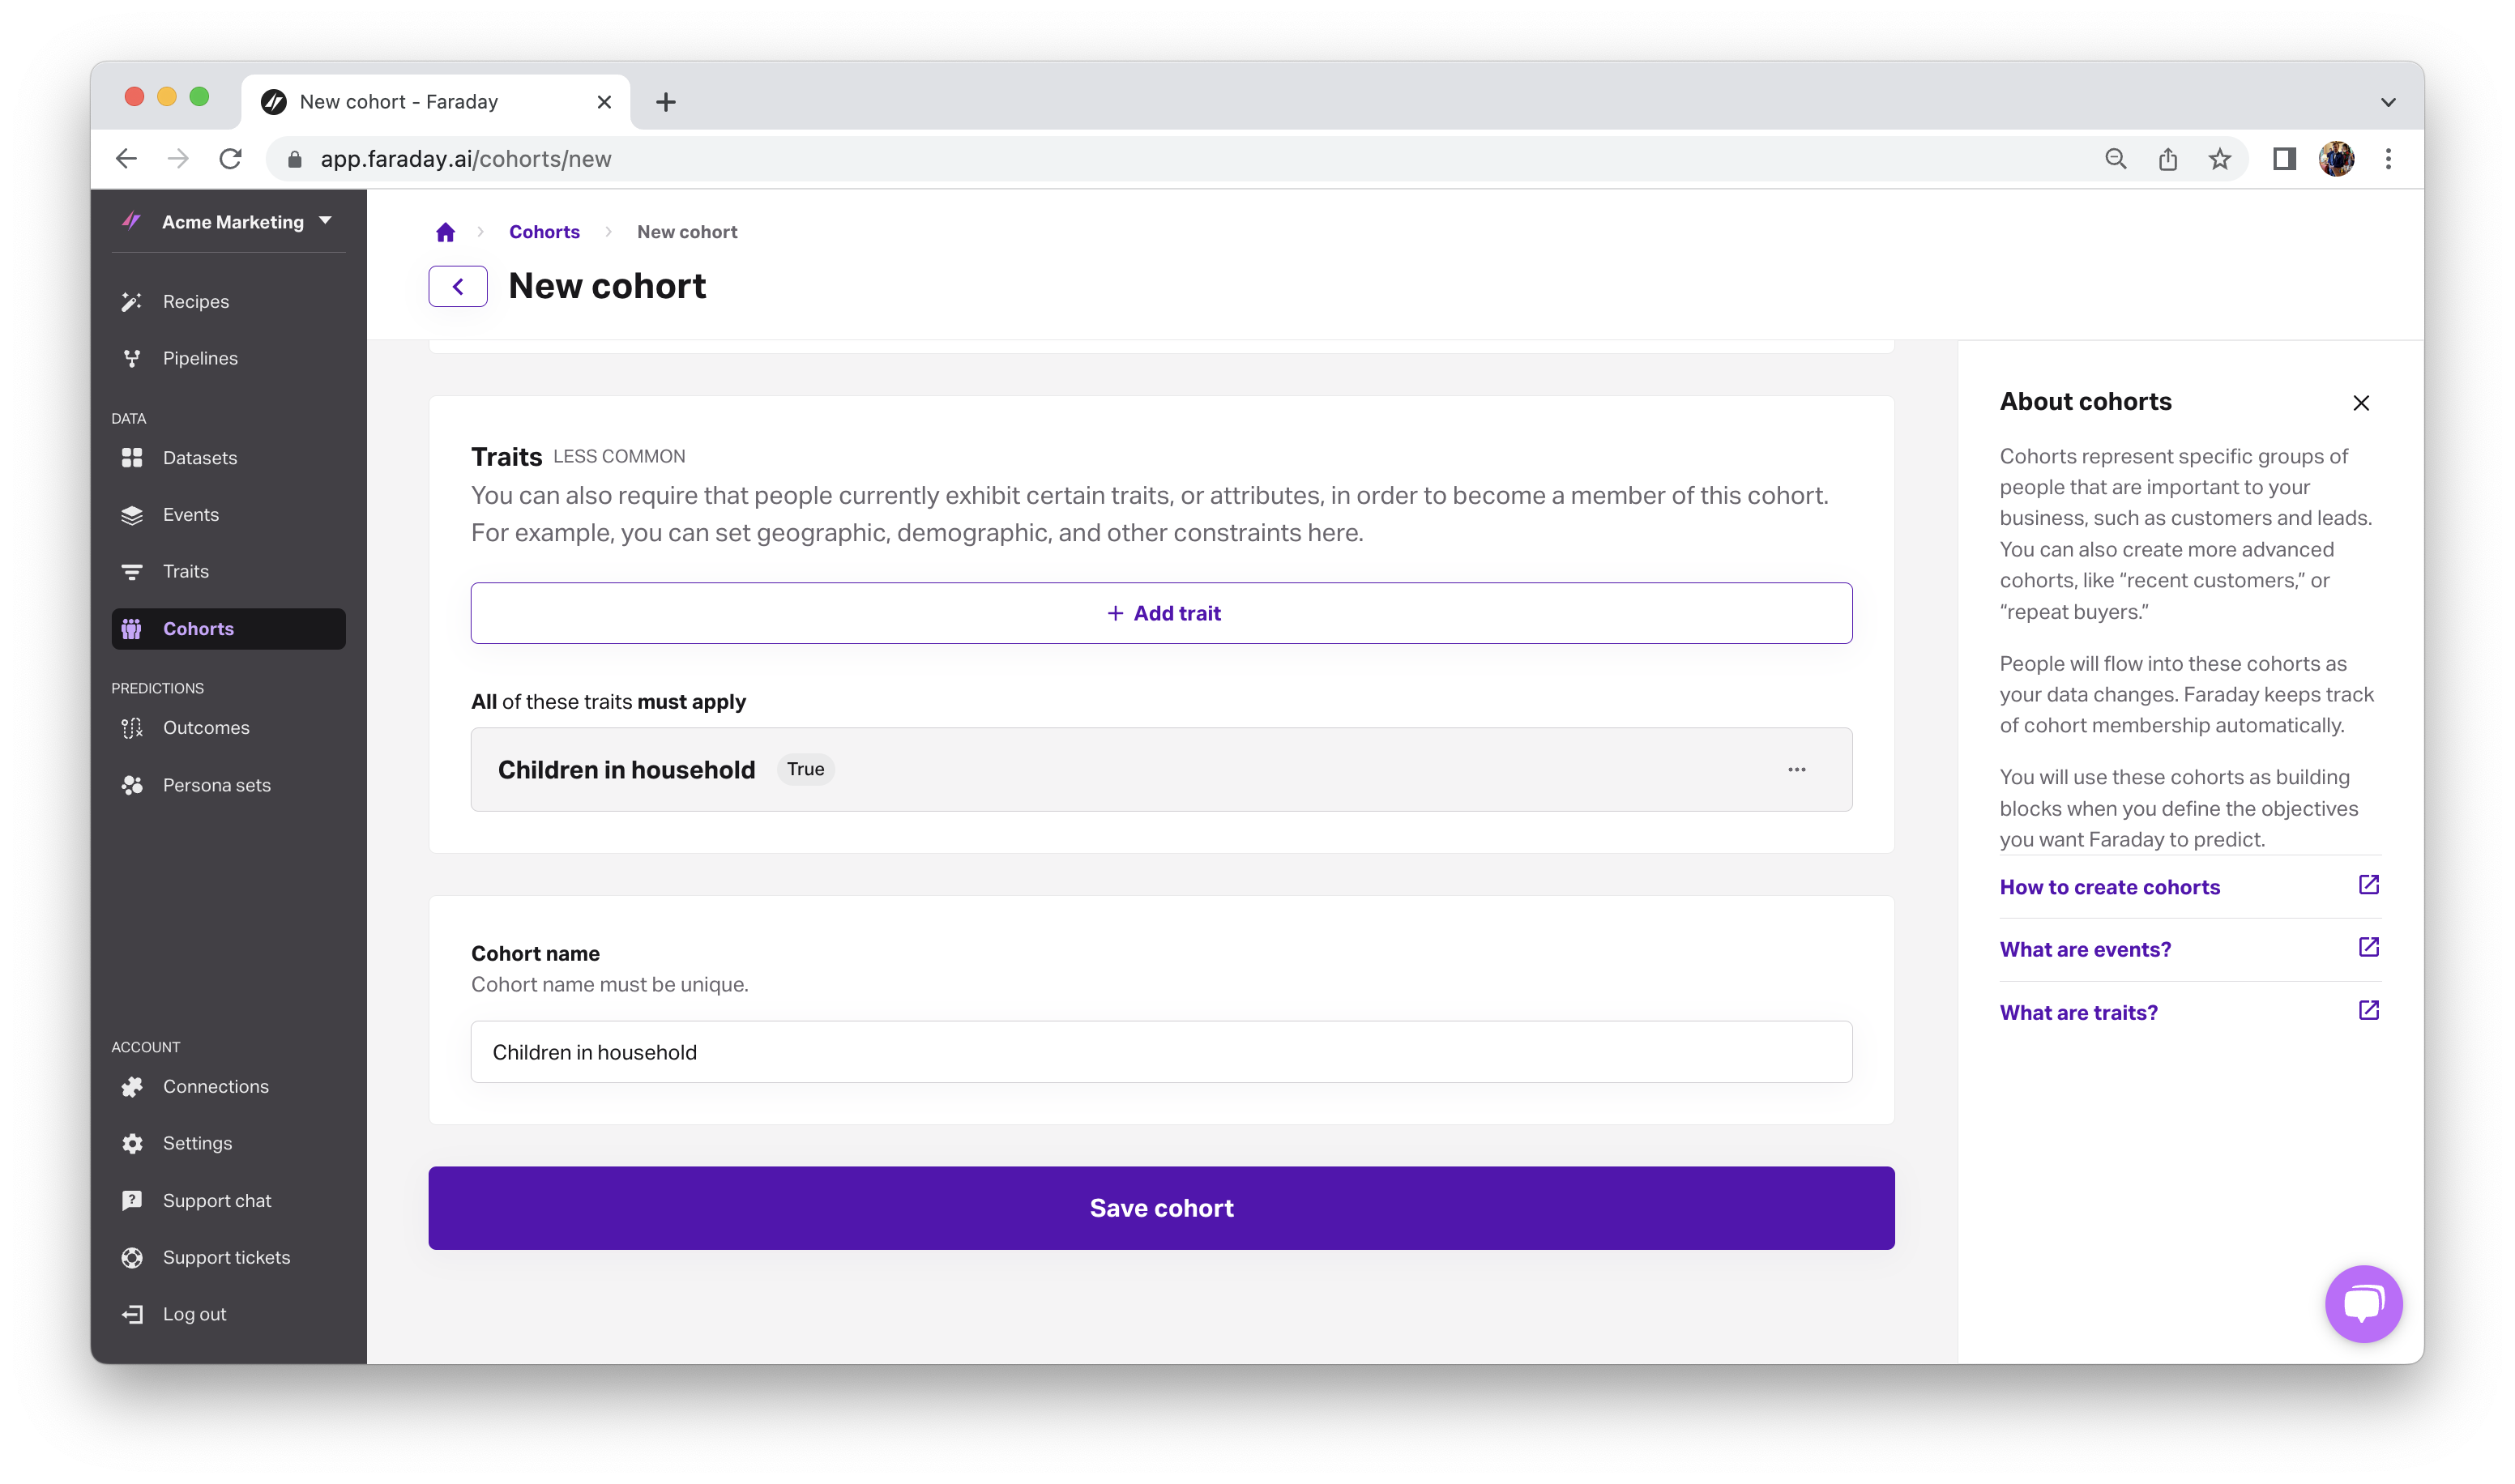
Then, in cohorts, you’ll utilize both your customer data and Faraday’s built-in consumer data to build the exact cohort–or interesting group of people–you want. To continue with the nursery humidifier example, you’ll define a cohort for your customers, and a cohort using the trait for children in household, sourced from Faraday’s rich, cookieless, opt-in consumer data, to target with your propensity to buy predictions.
Predict propensity to buy to hone in on likely buyers
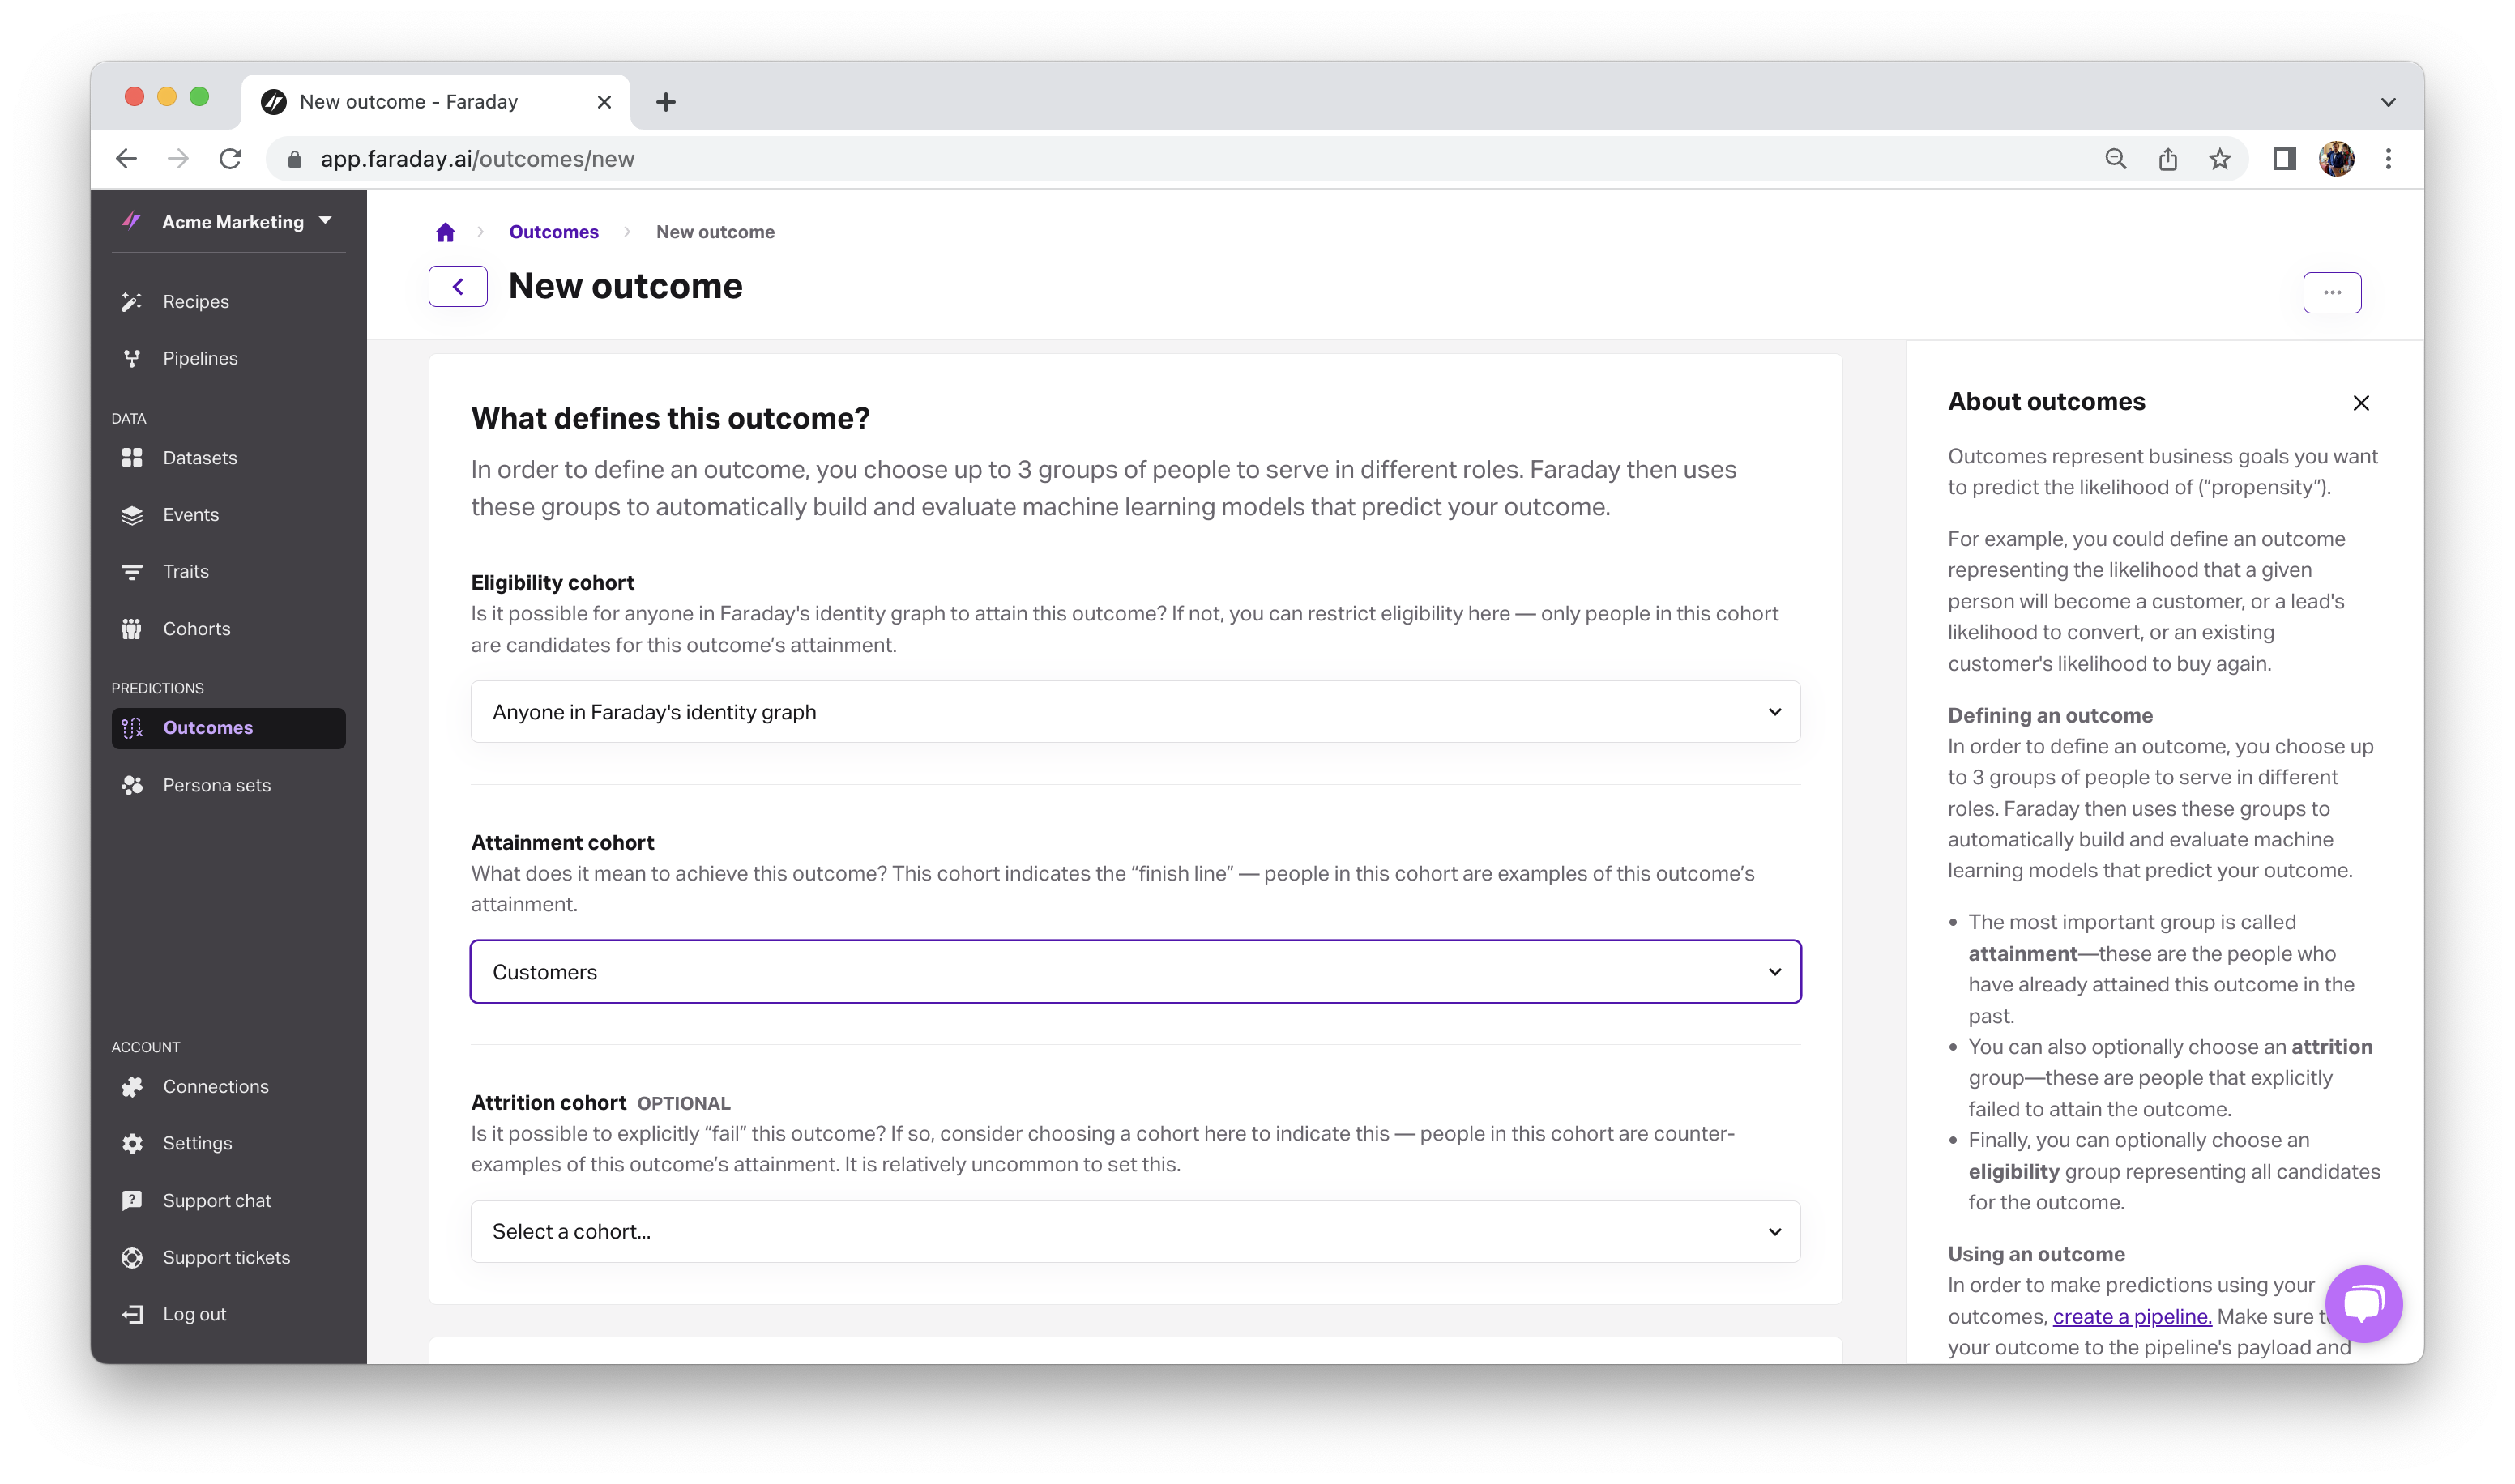
With your cohorts defined, build your predictive outcome by choosing your attainment, or your customers. Here, you’re defining your propensity to buy, or the likelihood that anyone in the U.S. is going to become a customer by making a purchase.
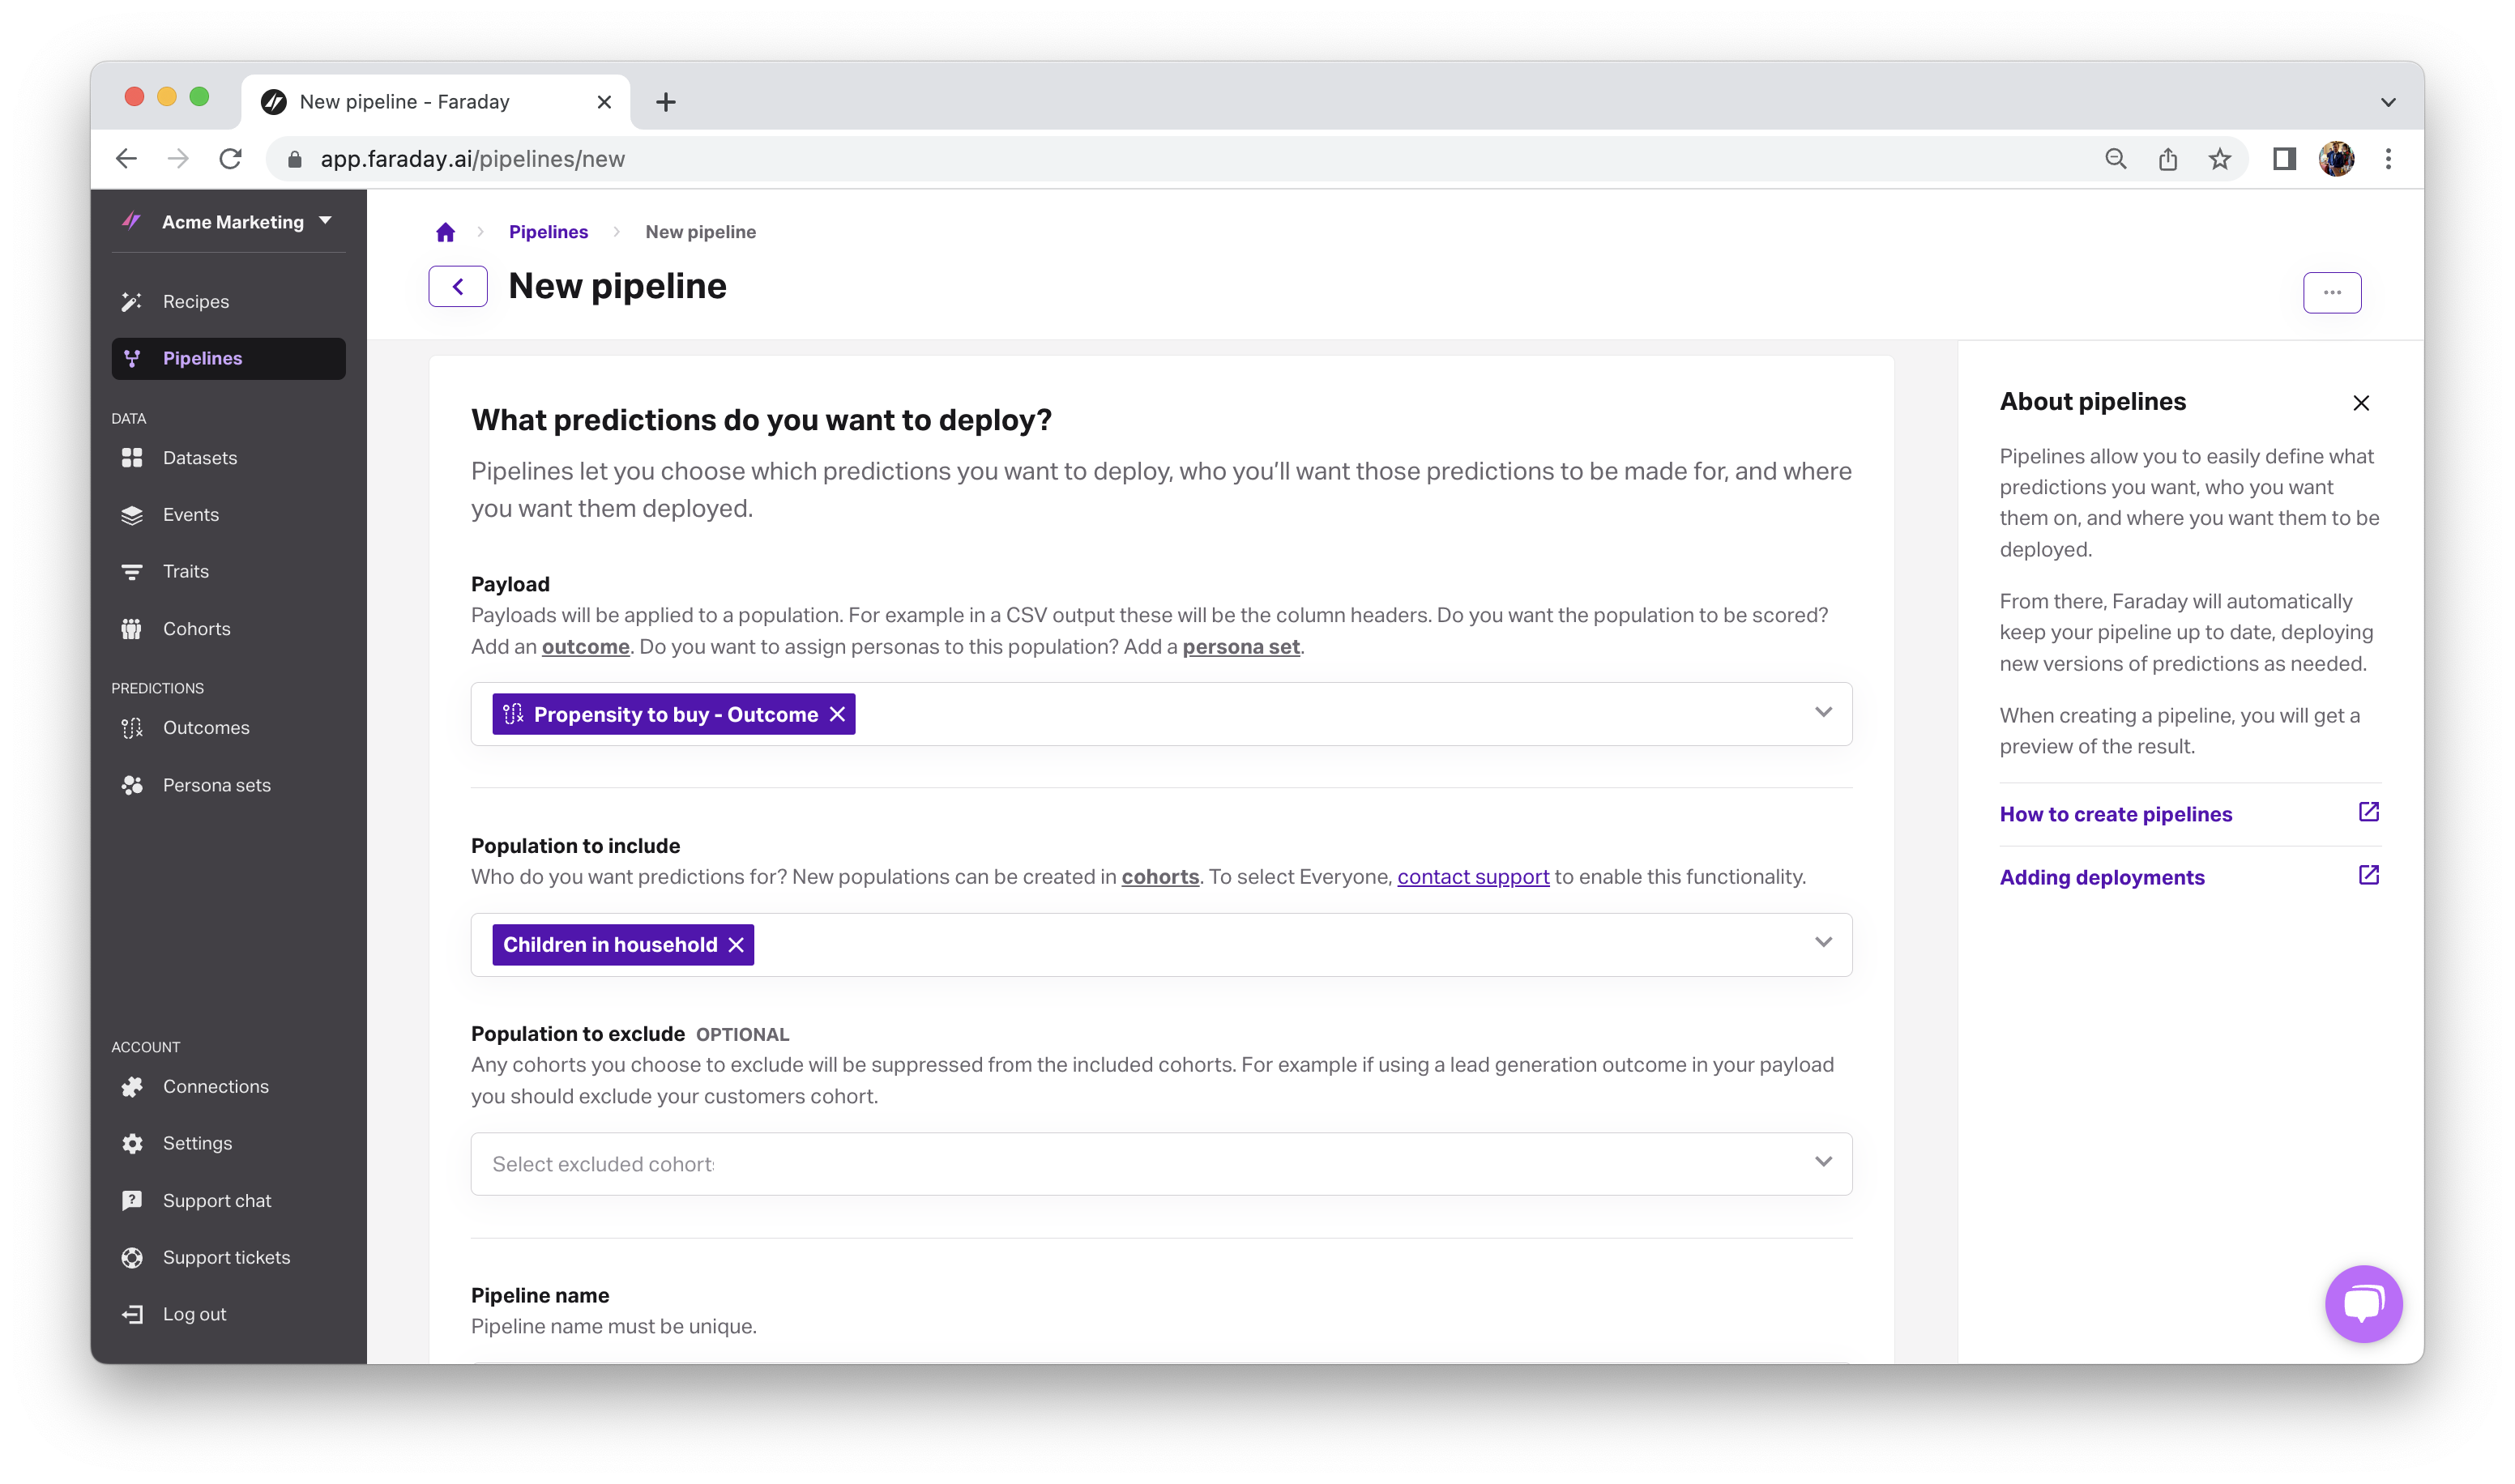
Now that your predictions are defined, create a pipeline to make them actionable by choosing your likely buyers outcome and your children in household cohort.
Machine learning algorithms then get to work predicting how likely people across the country with children in the household are to buy your new nursery humidifier. You can even further your bottom up market sizing analysis by generating customer personas and their predicted lifetime value with your brand.
Deploy likely buyer scores to your analysis tools
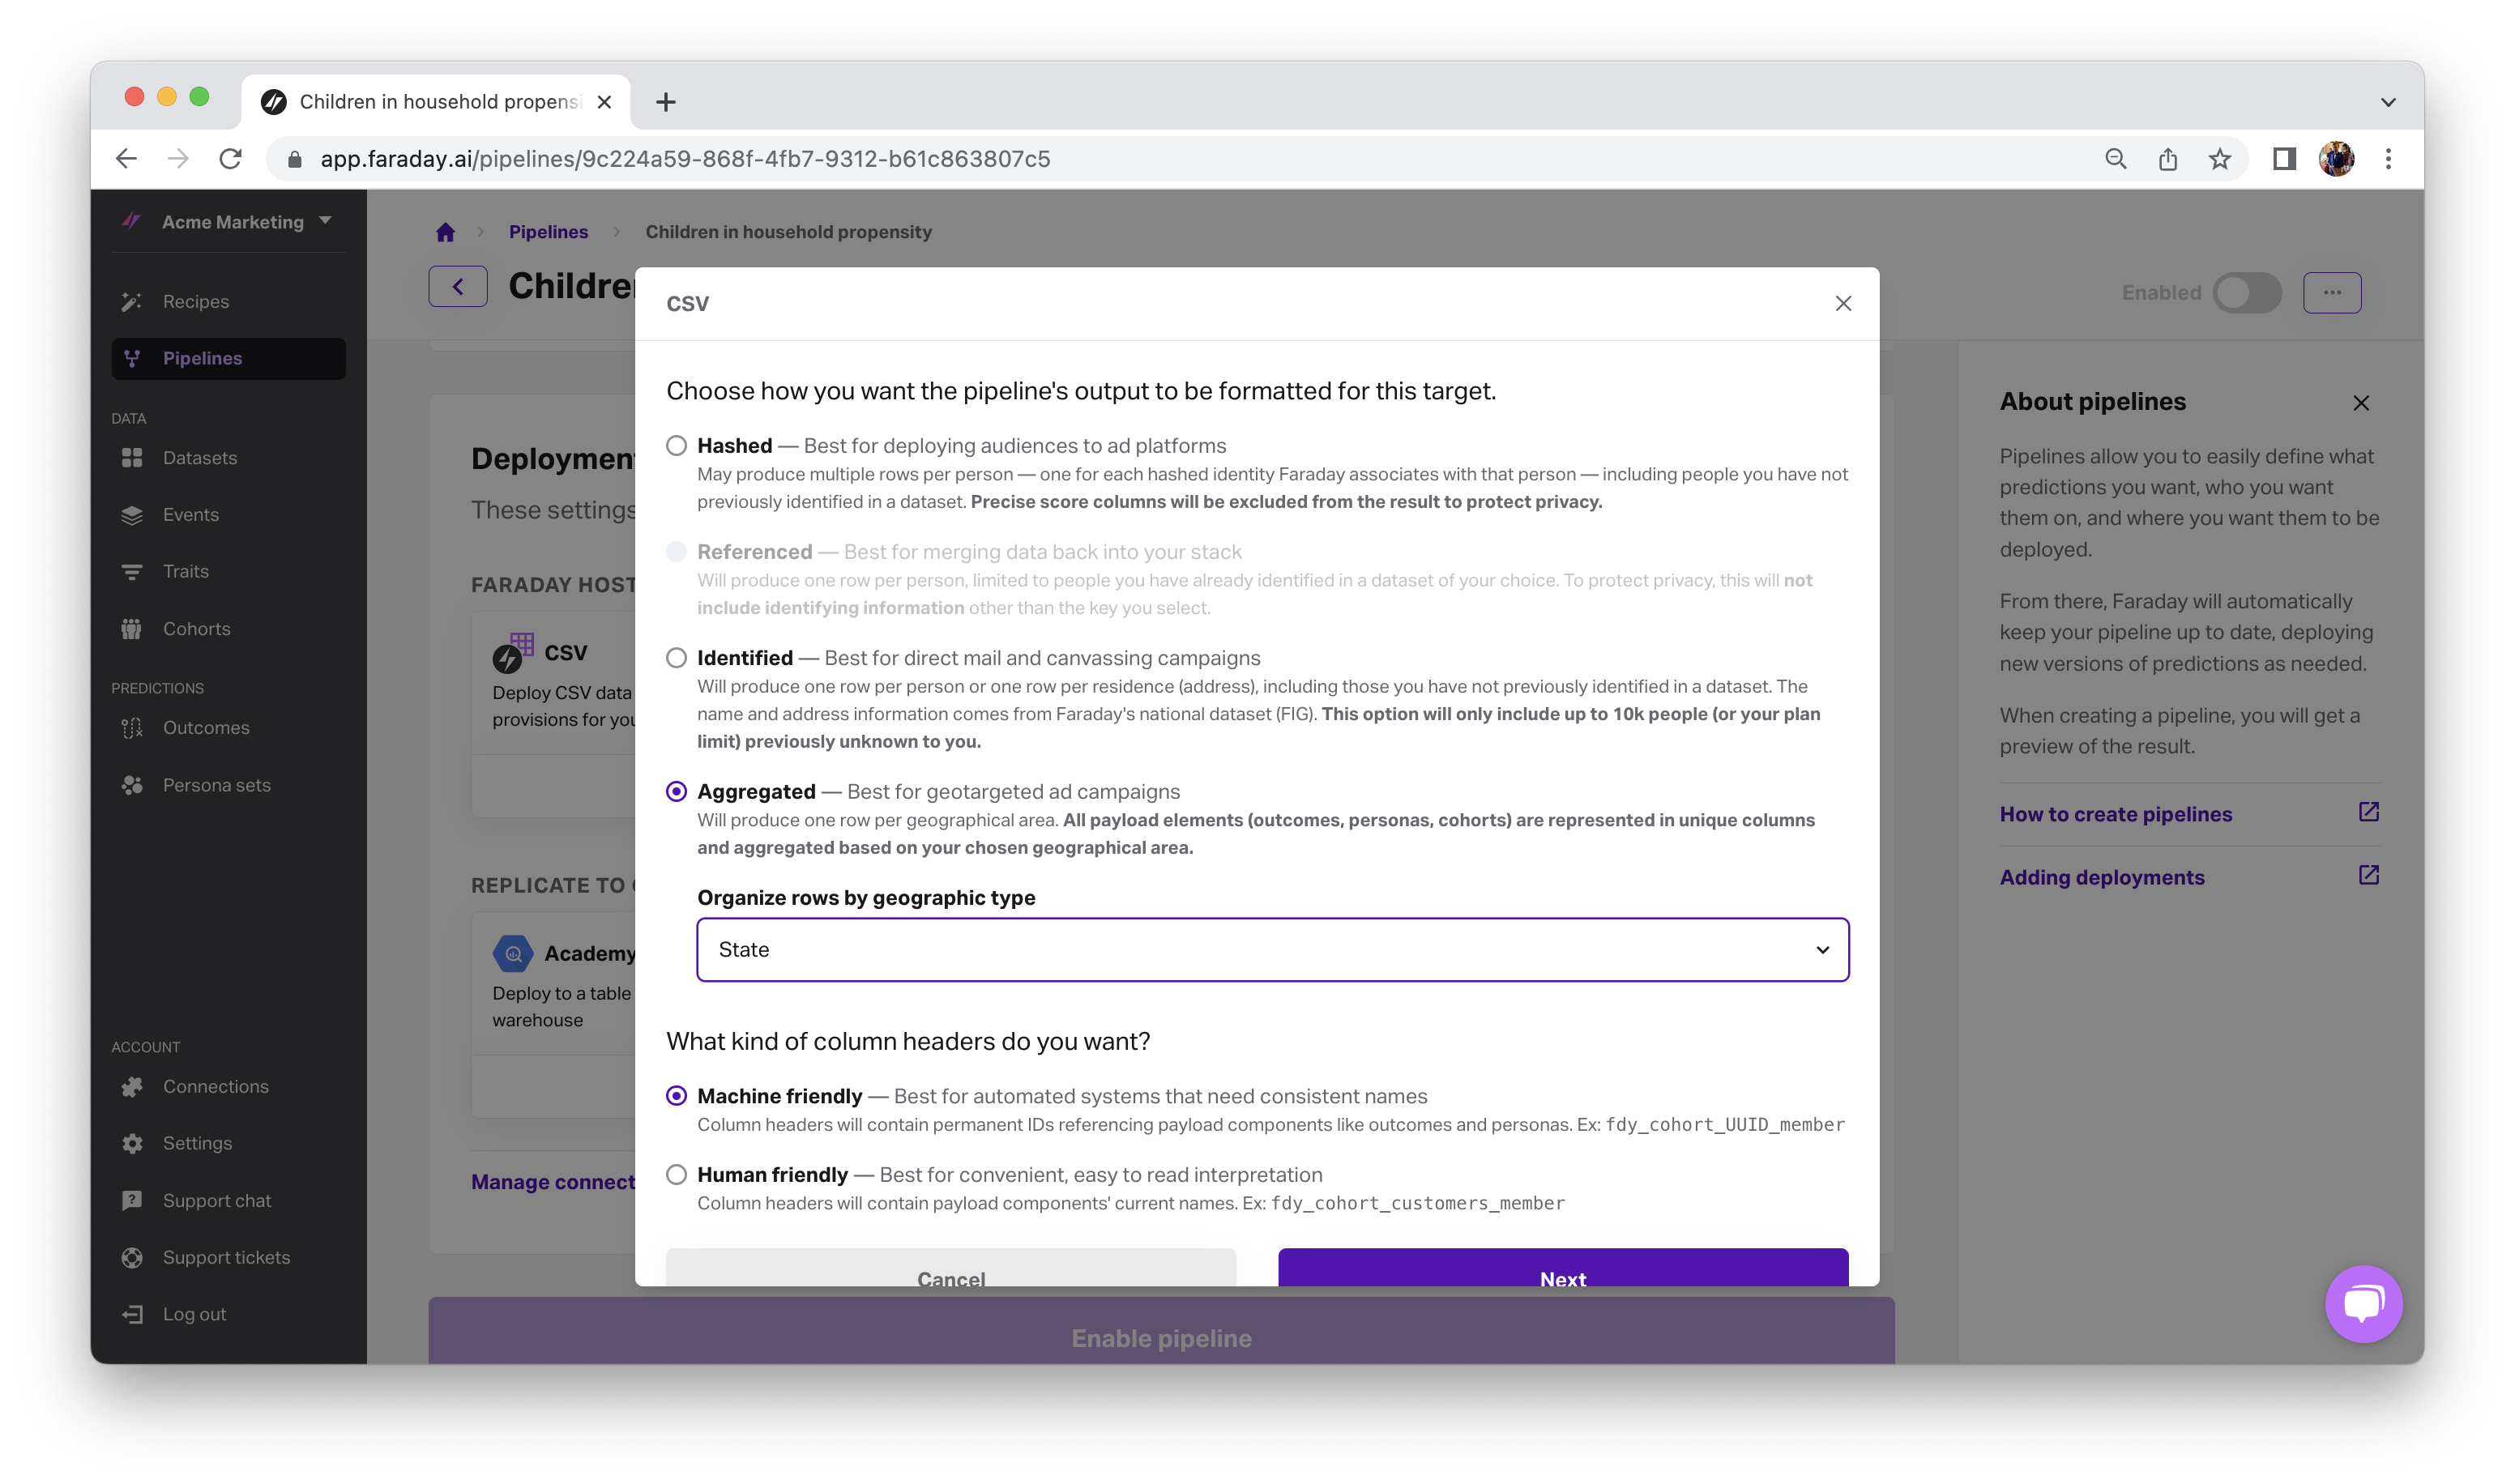
Finally, deploy your likely buyer predictions back to your stack, via CSV file for versatility, or right back into your database or data warehouse for analysis in your BI tools. When deploying, filter to whatever aggregation level makes the most sense for your strategy: county, state, city, or metro. In this example, perhaps choosing state will reveal that the driest states in the country have the highest propensity to buy individuals.
With the predictive approach to bottom up market sizing, you have access to likely buyer scores anywhere in your stack in just a few clicks, providing insight into what geographic locations your company has the most high-intent buyers in so that your market size is more than just a rough estimate–it’s actionable and data-backed.
Ready to try it out? Create a free account.
Andy Rossmeissl
Andy Rossmeissl is Faraday’s CEO and leads the product team in building the world’s leading context platform. An expert in the application of data analysis and machine learning to difficult business challenges, Andy has been running technology startups for almost 20 years. He attended Middlebury College and lives with his wife in Vermont where he lifts weights, makes music, and plays Magic: the Gathering.

Ready for easy AI?
Skip the ML struggle and focus on your downstream application. We have built-in demographic data so you can get started with just your PII.