How Faraday uses dynamic predictions to choose the best model for you
Predictive patterns change over time. Faraday uses dynamic predictions to choose the best model for you based on subject tenure.


Predictive patterns change over time. When it comes to predicting customer behavior, it’s entirely likely that a person who’s been a lead for say, three months, is going to behave differently than someone who just signed up for your mailing list. The former has been receiving your email drip for a few weeks, is aware of your offerings, and probably has a decent idea of what they’re looking for. The latter is much closer to the top of the funnel, and is just getting to know your business better.
Why does this matter? Well, the person that just subscribed to your mailer might be less likely to convert compared to someone who’s been interacting with your business for 3 months - or they might not be! If the behavior “visited your site 3x” tends to be highly predictive of conversion, that’s only relevant to leads who’ve had the time in the funnel to actually visit your site more than once, so a different model should be used for fresh leads. Additionally, aggregated data is used to capture the situation of a person at the time of prediction. For example, has a new email been sent since we last produced a prediction?
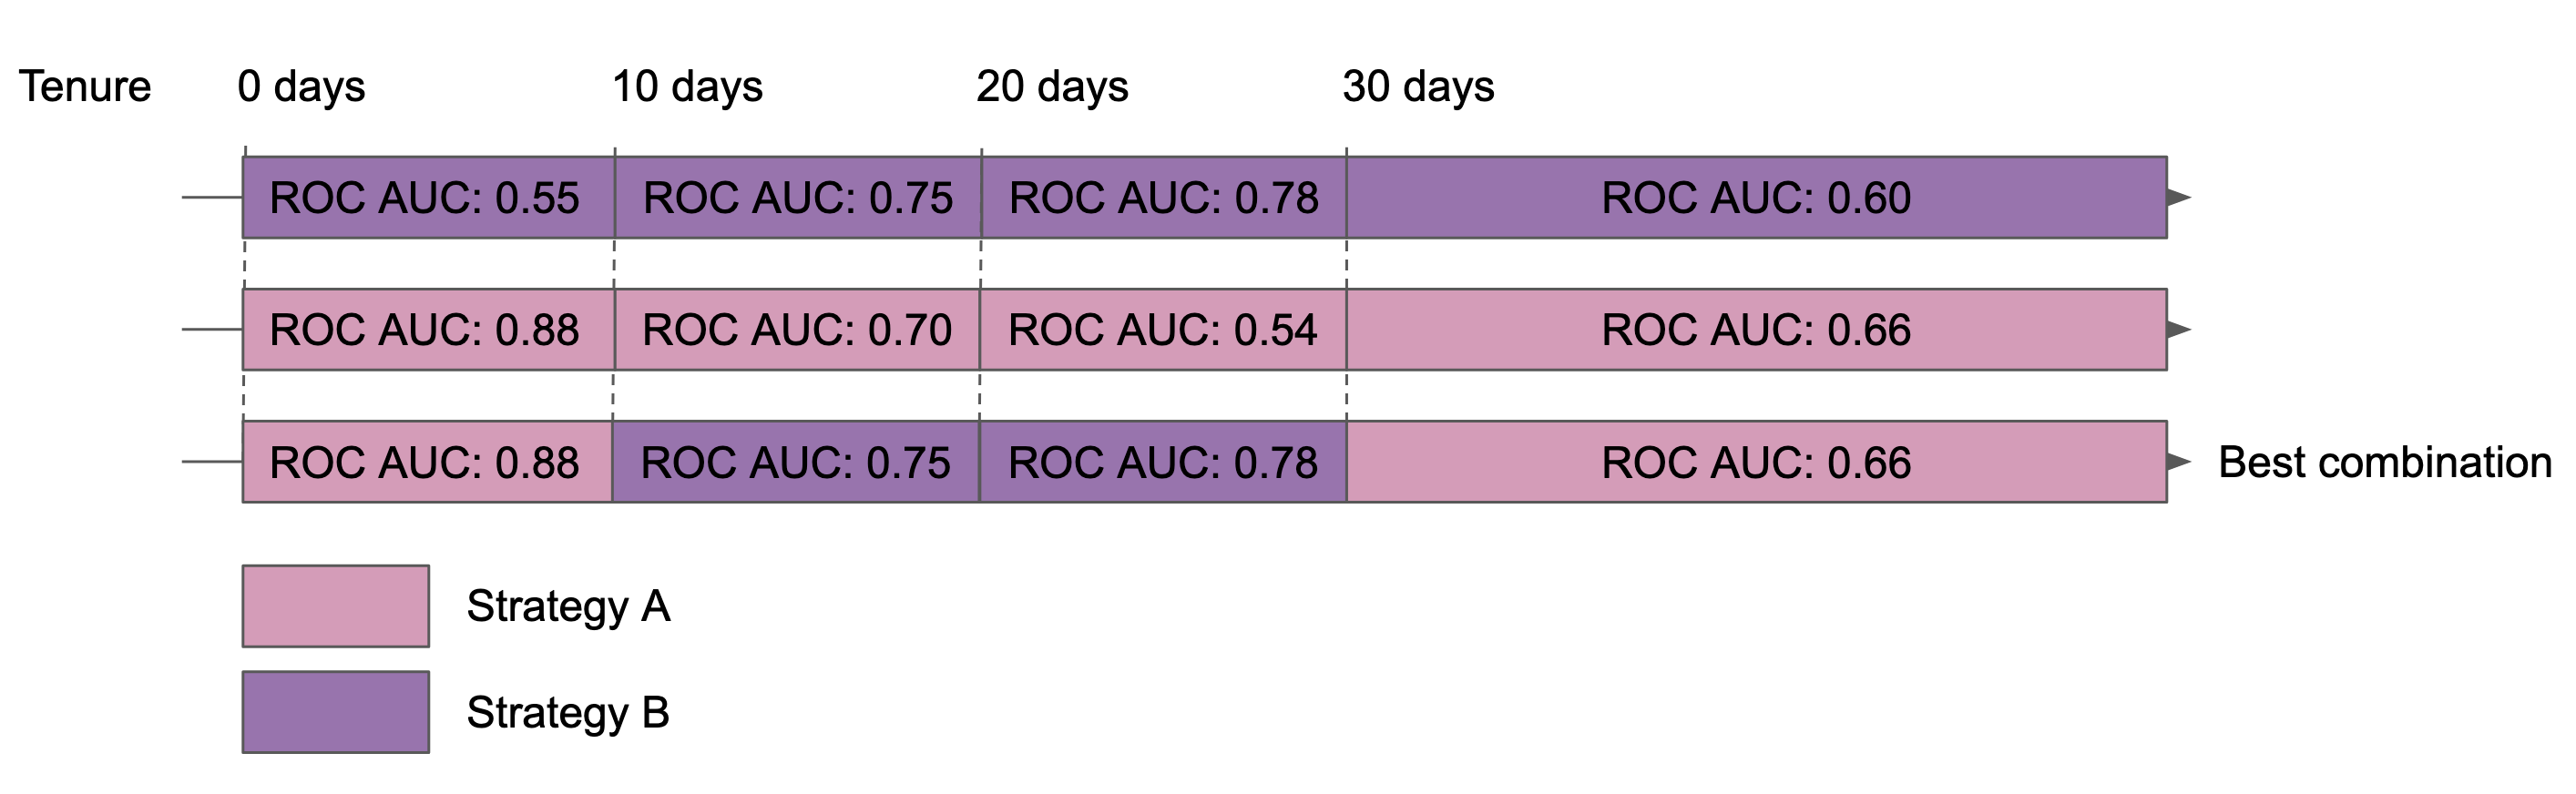
With dynamic prediction, we create predictive models for several tenure bins, or periods of time, that someone has been in the eligibility cohort that you’re using for your prediction (i.e. their funnel stage). Then, we use the best possible model to make predictions on an individual based on that tenure bin. In the below example, you can see two strategies applied (A and B) across four tenure bins (0, 10, 20, and 30 days). In it, strategy A scored higher for the bins of 10 and 20 days, while B scored higher for 0 and 30 days, which means the optimal scoring combination is to use strategy A to score people that have been in the cohort for 0-10 days, strategy B for those in it for 11-20 days and 21-30 days, and A again for those in it for 30+ days.
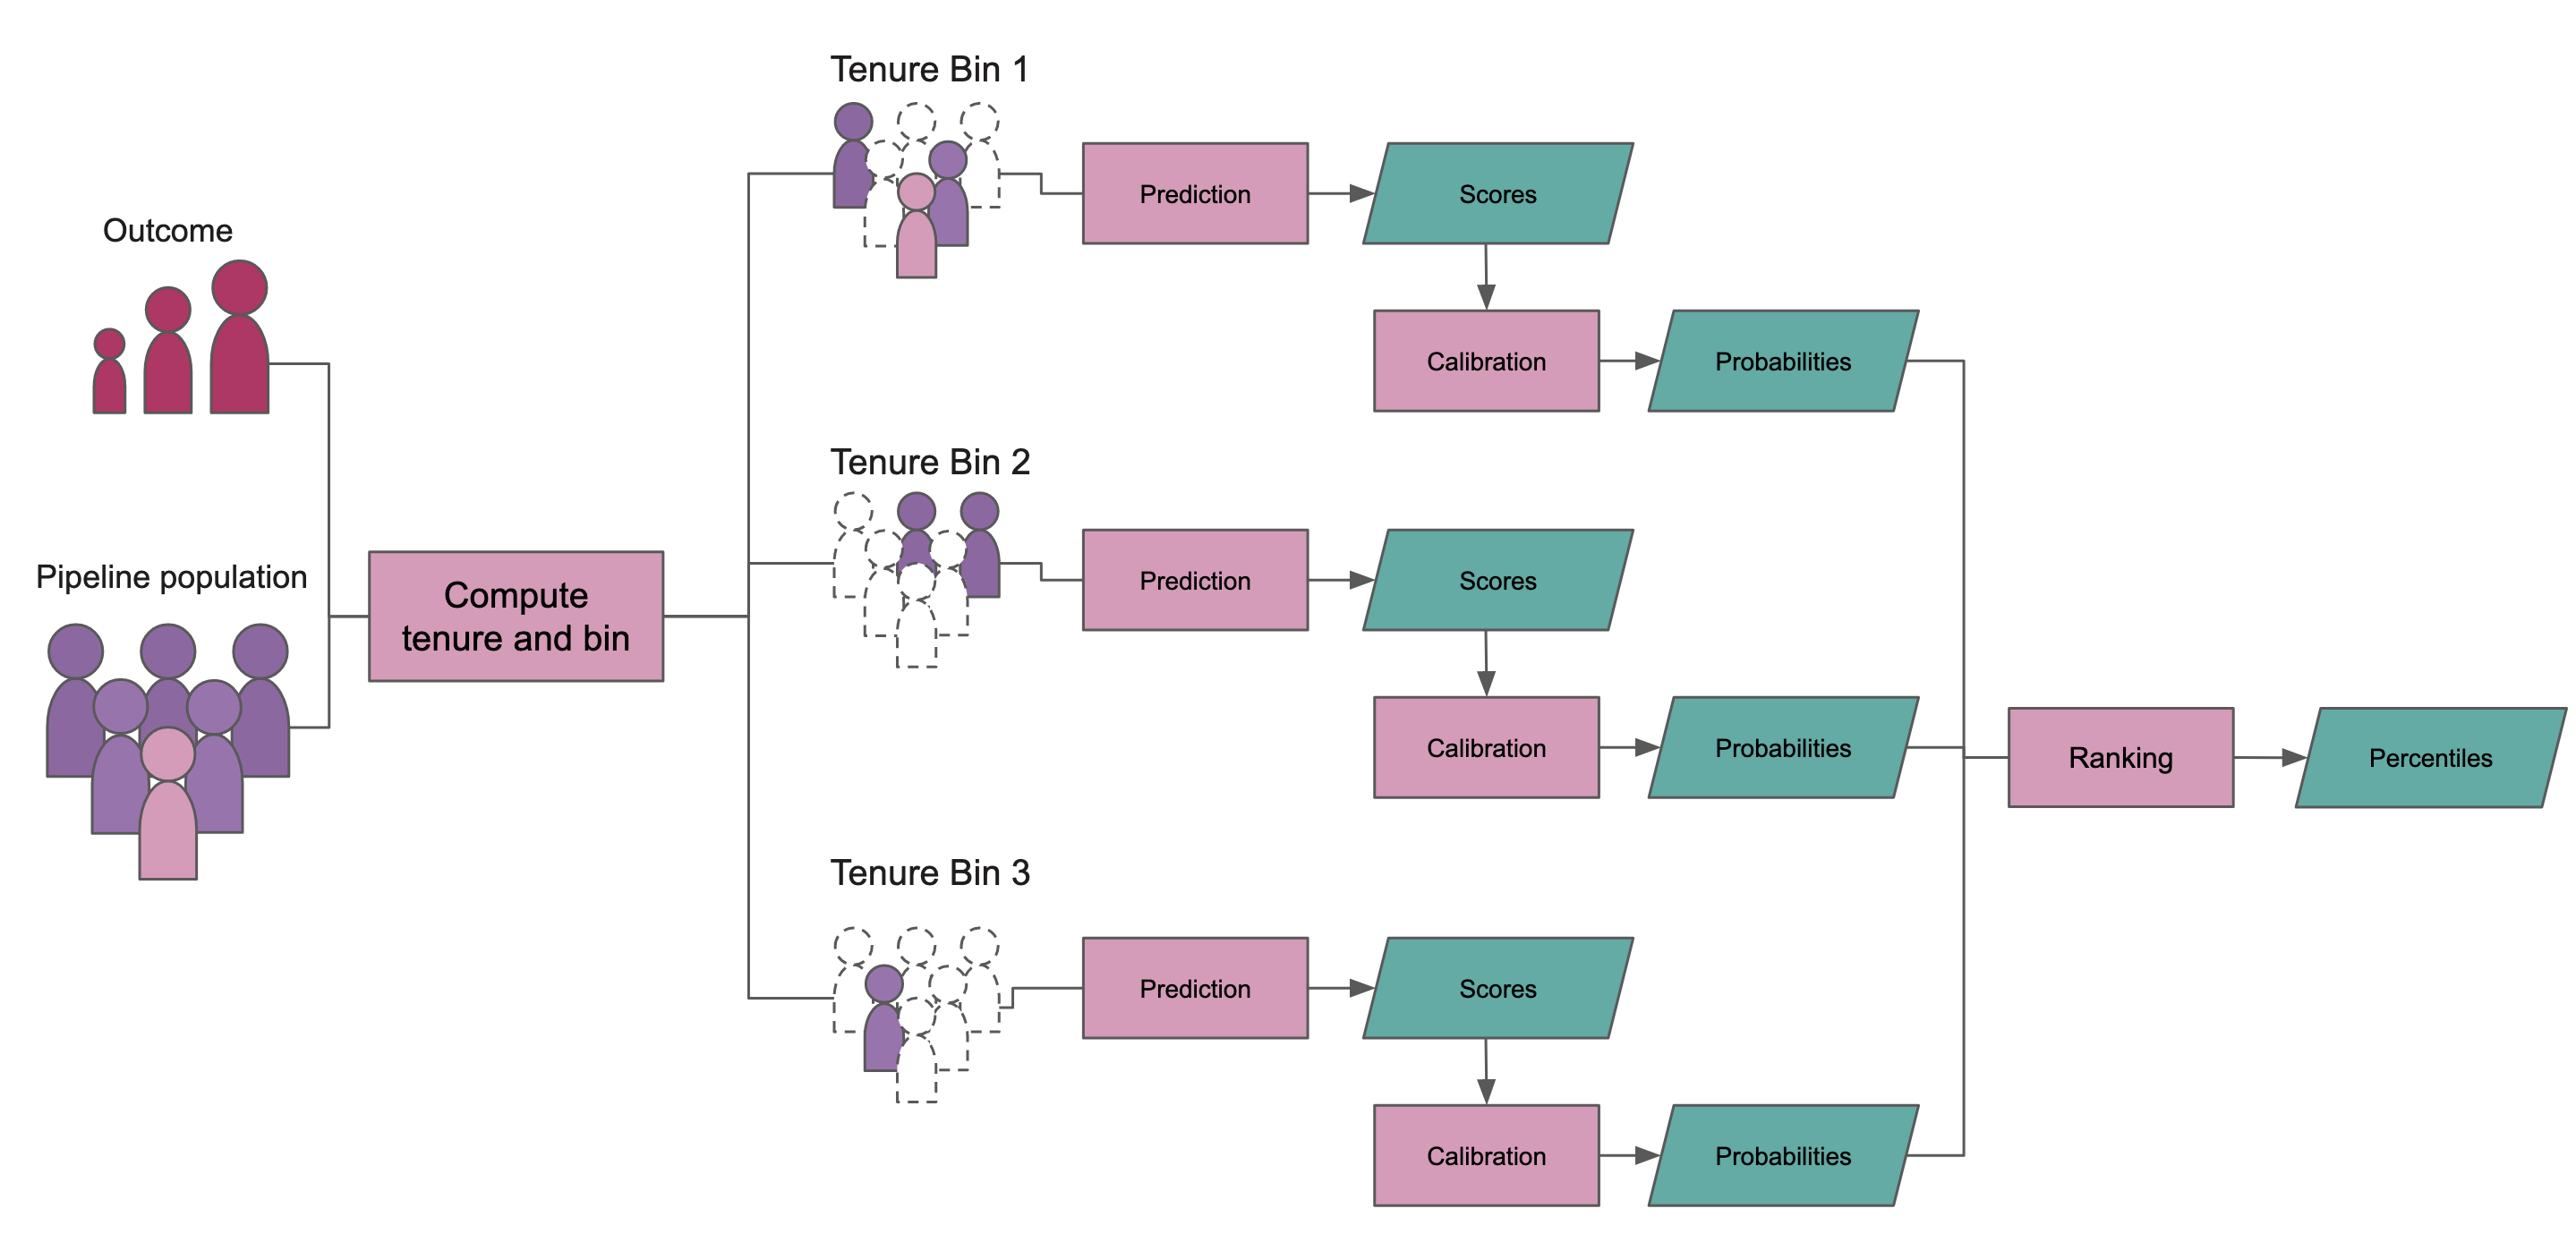
To illustrate this point further, below is an example of a pipeline that uses tenure bins to select the best model for each tenure group. In it, you can see the pipeline population group is broken down into three tenure bins, each of which has a “best” predictive model that’s used for scoring.
 For further reading on Faraday model calibration and probability scores, check out this blog post.
In short, dynamic prediction enables us to provide scores that update with your data, ensuring accurate, powerful predictions for all stages of the customer lifecycle.
Andy Rossmeissl
Andy Rossmeissl is Faraday’s CEO and leads the product team in building the world’s leading context platform. An expert in the application of data analysis and machine learning to difficult business challenges, Andy has been running technology startups for almost 20 years. He attended Middlebury College and lives with his wife in Vermont where he lifts weights, makes music, and plays Magic: the Gathering.

Ready for easy AI?
Skip the ML struggle and focus on your downstream application. We have built-in demographic data so you can get started with just your PII.