Making sense of feature importance: Why 3% matters more than it might seem
Feature importance in Faraday Outcomes and Recommenders shows which datapoints—like age or buying habits—had the biggest impact on the model’s predictions, helping you understand not just what drove decisions, but how and why.


In every Faraday Outcome or Recommender, you’ll find a list of datapoints—things like age range, buying habits, or location—that influenced the model’s predictions. This is called feature importance.
Each trait is given a percentage that represents how much it contributed to the model’s decisions. The list is sorted by level of impact, so the features at the top are the ones the model relied on most.
That percentage might seem small at first—especially if you’re seeing numbers like 2% or 3%. But those numbers can carry more weight than you’d expect. Let’s take a closer look.
Imagine you're using our dashboard for the first time
You scroll to the Data section of your Outcome and see a list of features with importance percentages—maybe something like this:
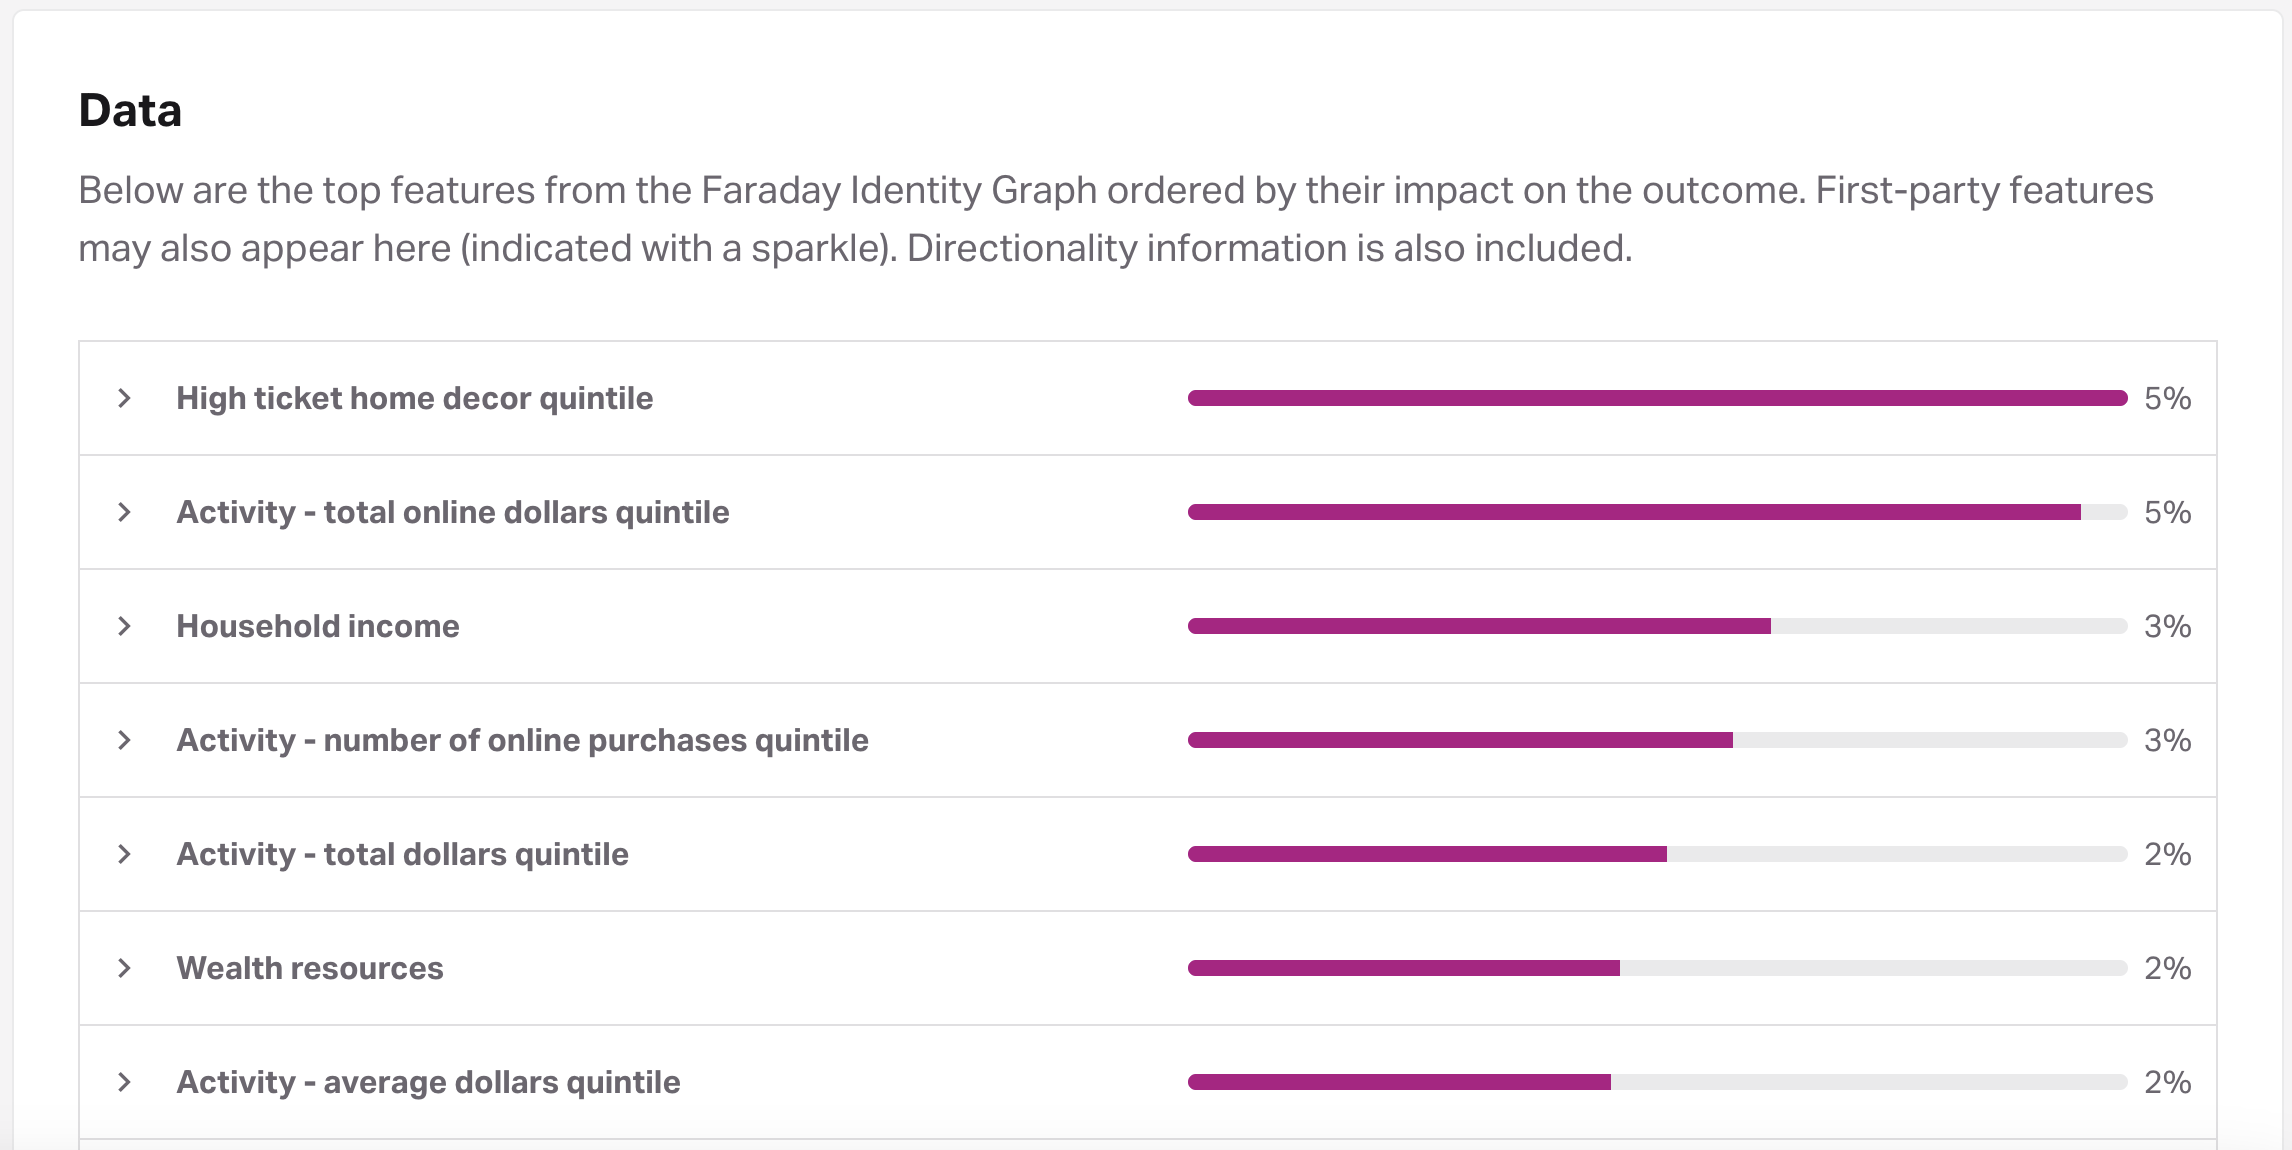
If you're new to predictive modeling, this might raise a few questions:
- Is 3% good, that seems low?
- Should I be paying attention to this number?
- Why are all the numbers so small?
- How do I know what’s really driving the model?
These are totally valid questions. Let’s break it all down, step by step.
Why 3% can be a big deal
To really understand why 3% can be a big deal, it helps to zoom out and understand how feature importance works in the first place.
When we train a predictive model, it starts by looking across a huge number of datapoints—over 1,400 possible features in our Faraday Identity Graph—to find patterns that relate to the outcome you're trying to predict (like conversion, churn, etc.). But not every feature is useful. Some are noisy, redundant, or irrelevant for your specific business case. So the model filters that list down to only the features that carry a useful predictive signal—on average, that’s around 200 features.
Once the model is trained, we calculate feature importance to give you a sense of which of those ~200 features made the biggest impact. Each feature gets assigned a percentage that represents its contribution to the model’s predictions. All of those contributions are added up and scaled so they sum to 100%—that way, you can compare them directly.
Now here’s the key part: if every feature contributed equally in a 200-feature model, each one would have about 0.5% importance. But that’s not how models work. In practice, some features matter way more than others. So when one feature stands out with 3% or more, it’s doing a lot of heavy lifting.
It’s kind of like being the lead vocalist in a 200-piece choir. Sure, everyone’s contributing—but a few voices are probably carrying the melodies that most of the audience will notice. Those top features are the ones your model is leaning on to make decisions.
What should I look for in the list?
Instead of just reading the numbers one by one, look for patterns:
- If your top 20 features are all clustered between 2–3%, it means the model is pulling from a wide range of signals. It’s a balanced prediction strategy, where no single feature dominates.
- But if your top 2 features are 5% and everything else drops off quickly—say, under 1%—then those top datapoints are carrying a lot more weight in the model’s decision-making.
In other words, the relative spread tells you more than any single number. The top features can help you understand what kinds of datapoints are making people more (or less) likely to take the action you're predicting.
What about features working together?
This is where things get a little more subtle. Some features don’t just matter on their own—they’re powerful in combination with others.
For example, maybe age by itself is helpful, and income level is too—but together, they might form a much stronger signal. These kinds of relationships are called interactions, and our models are built to detect them.
That said, interactions don’t always show up clearly in a list of feature importances. A feature might look low on the list, but still be playing a key supporting role behind the scenes.
So what if a feature is too important?
In most models, a well-distributed mix of features is ideal. So if you see a single one standing out dramatically with a notably high importance score—we’re not talking about 6% as much as 40-50% here—that is likely a signal worth digging into.
What’s happening? Here are a few possibilities:
- The model may be over-relying on a single feature, which means it's leaning heavily on one signal while ignoring others. That can make the model less flexible and more vulnerable to changes in that one trait. If the feature drops out of future data or its relationship to the outcome shifts, the model may perform poorly.
- It might be a sign of data leakage—where the feature is unintentionally revealing information about the outcome it’s supposed to predict. For example, if a feature like "last purchase amount" correlates almost perfectly with whether someone converted, the model may appear highly accurate during training but fail in the real world. This is sometimes referred to as "cheating," and it’s one of the biggest pitfalls in predictive modeling.
This doesn’t mean there is a problem, but it certainly is worth a closer look. If you see a feature with importance that looks too high, reach out to us—we’ll take a closer look and either help you interpret the results, or make a change if something is happening in your model that shouldn’t.
Directionality
Each feature also includes directionality, which shows whether specific traits had a positive or negative influence on predictions.
This means you’re not just seeing how much something mattered—you’re also seeing how it mattered. For example, you might find that high-income households were more likely to convert (positive direction), while certain lifestyle types were less likely (negative direction). That context can be incredibly useful when refining messaging or targeting strategies.
You can read more about this aspect of feature importance in our previous blog.
So what can you do with this info?
Once you understand what’s influencing your model, you can start using that insight in your day-to-day work:
- Messaging: If homeownership is one of your top features, your messaging might speak more directly to homeowners.
- Targeting: If younger age ranges rank high, that could shift who you prioritize in your outreach.
- QA: Seeing a feature rank high that shouldn’t be relevant? That’s a good moment to raise a flag and chat with us—we want your model to reflect reality, not noise.
Importantly, feature importance isn’t a checklist of what to act on—it’s a lens into what the model “sees” as predictive. Use it to guide your thinking, not to replace your judgment.
Still have questions about what you’re seeing in your Outcome?
We’ve got you covered. Just reach out to support—we’re always happy to walk through it with you!
Ben Rose
Ben Rose is a Growth Marketing Manager at Faraday, where he focuses on turning the company’s work with data and consumer behavior into clear stories and the systems that support them at scale. With a diverse background ranging from Theatrical and Architectural design to Art Direction, Ben brings a unique "design-thinking" approach to growth marketing. When he isn’t optimizing workflows or writing content, he’s likely composing electronic music or hiking in the back country.

Ready for easy AI?
Skip the ML struggle and focus on your downstream application. We have built-in demographic data so you can get started with just your PII.