Recommenders
Recommender predictions allow you to predict which product, service, or other offer that any individual is likely to respond best to.
Recommenders overview
Recommenders allow you to use any event properties from events in your datasets to predict which product, service, or other offer any individual will respond best to. For example, a recommender that uses the event property product will output the top products that an individual is likely to respond best to. This insight can help you tailor how you engage with them in order to achieve the best results. Recommenders aren't exclusive to just product recommendations–they can also be used to predict next action in a series, like next logical banking action.
Once you've created a recommender, you'll add it to the payload in a pipeline, then choose the cohort that you'd like to target with your recommender predictions. From that pipeline, you'll create a deployment to send your predictions to either a connection you've created, or to a CSV file.
Recommenders are just one of the ways that customer predictions can help you make every experience that a customer or lead has with your business exceptional. Try them in combination with persona predictions to maximize the customer experience.
Learn more about how to interpret your recommenders, including an example for how many recommendations you might use, on our blog.
📘When should I use a recommender instead of an outcome?
Recommenders are best suited to predict events that are part of a series, such as when you're interested in seeing if individuals will purchase product B or C after having purchased product A, or if the next logical action a banking customer might take is set up auto-deposit after having created an account. For conversion predictions, such as likelihood to churn, create an outcome instead.
Analyzing a recommender
Once your recommender is complete and its status is ready, various features to analyze will populate in the recommender. This includes the performance of the model (through the metrics, accuracy chart, accuracy table, and ROC), or what kind of results you can expect when using this recommender, as well as the data features that were most important during the predictive model's build.
Recommender performance
Each completed recommender includes a performance section, which can serve to help you gauge how well the predictive model is performing, and therefore how strong your results might be should you use this recommender's predictions.
Metrics
The metrics tab includes Relative Operating Characteristic (ROC) score and the Faraday-specific Average Rank of Observed Property (AROOP) score.
- ROC AUC: ROC AUC is a score, on a scale of 0.0 to 1.0, that helps determine how well a model is performing. An ROC AUC of less than 0.5 indicates a configuration error. An ROC AUC of 0.5 indicates that the results are no better than a random guess, which means that the model is performing very poorly and is very unlikely to properly identify future conversions. On the other end, an ROC AUC of 1.0 indicates that the model is likely too good to be true, thus an ideal ROC AUC should be in somewhere in the middle.
For a recommender, Faraday considers a binary scenario while training the model–whether the event in question occurred or not–where the result is the likelihood of an individual and a given event happening. These binary predictions are then ranked per individual in order to create the recommendation.
- AROOP: AROOP is defined during recommender training, and is the average rank of the recommendation corresponding to the true next experienced events. It's a measurement of how good the recommender is at promoting the true next event to the top of the recommendations. The lower the AROOP, the more likely the true next event is to be captured in the top recommendations.
Accuracy chart
The accuracy chart tab displays two charts: accuracy per threshold and property distribution.
- Accuracy per threshold: This chart can be used as a measurement of how many recommendations you should leverage to achieve the best tradeoff between number of recommendations vs prediction accuracy. For example, an accuracy value of 0.75 for a threshold of 3 means that 75% of the individuals will have their next true event captured within the top 3 recommendations.
- Property distribution: This chart depicts the event distribution restricted to the top recommendations only across all individuals. For example, if Product A has a proportion of 0.18, or 18%, this means that across all individuals, 18% of them will have Product A as their top recommendation. This chart can be used to validate that the recommendations match the current event distribution.
Accuracy table
The accuracy table tab displays the same data from the accuracy chart, but in table format.
ROC
The ROC tab displays the ROC curve of the predictive model.
The ROC curve measures how well a model is performing. A well-performing will curve toward the Y-axis of true positive rate (TPR) before leveling out at 100%, as the TPR tells you how well the model is predicting true positives, or individual/event pairs happening. The dotted line represents a model that is as good as a random guess, or a coin-flip.
Recommender data
The data section of a recommender breaks down the top features or traits used in creating the recommender, ordered by their level of impact. These can include features from both your first-party data (indicated by a sparkle) and the Faraday Identity Graph. Each feature that had an impact on the outcome will be assigned a percentage based on its level of impact.
Recommenders are best suited to events in a series, such as purchasing a product or visiting a website, and as such, each recommender includes a dropdown menu to analyze data based on the number of occurrences for the event you're predicting, and whether or not individuals are identified by Faraday.
The recognition and experience to date dropdown can be used to filter based on the identification status of individuals, as well as their past event history.
By expanding a feature, you'll see its directionality, or the impact the feature has on the recommender ranking. Each feature's directionality is broken down into different bins based on how the feature in question breaks down (e.g. product category breaks down into sneakers, hats, etc). For example, your product category feature might include bins for sneakers, hats, and socks that you sell.
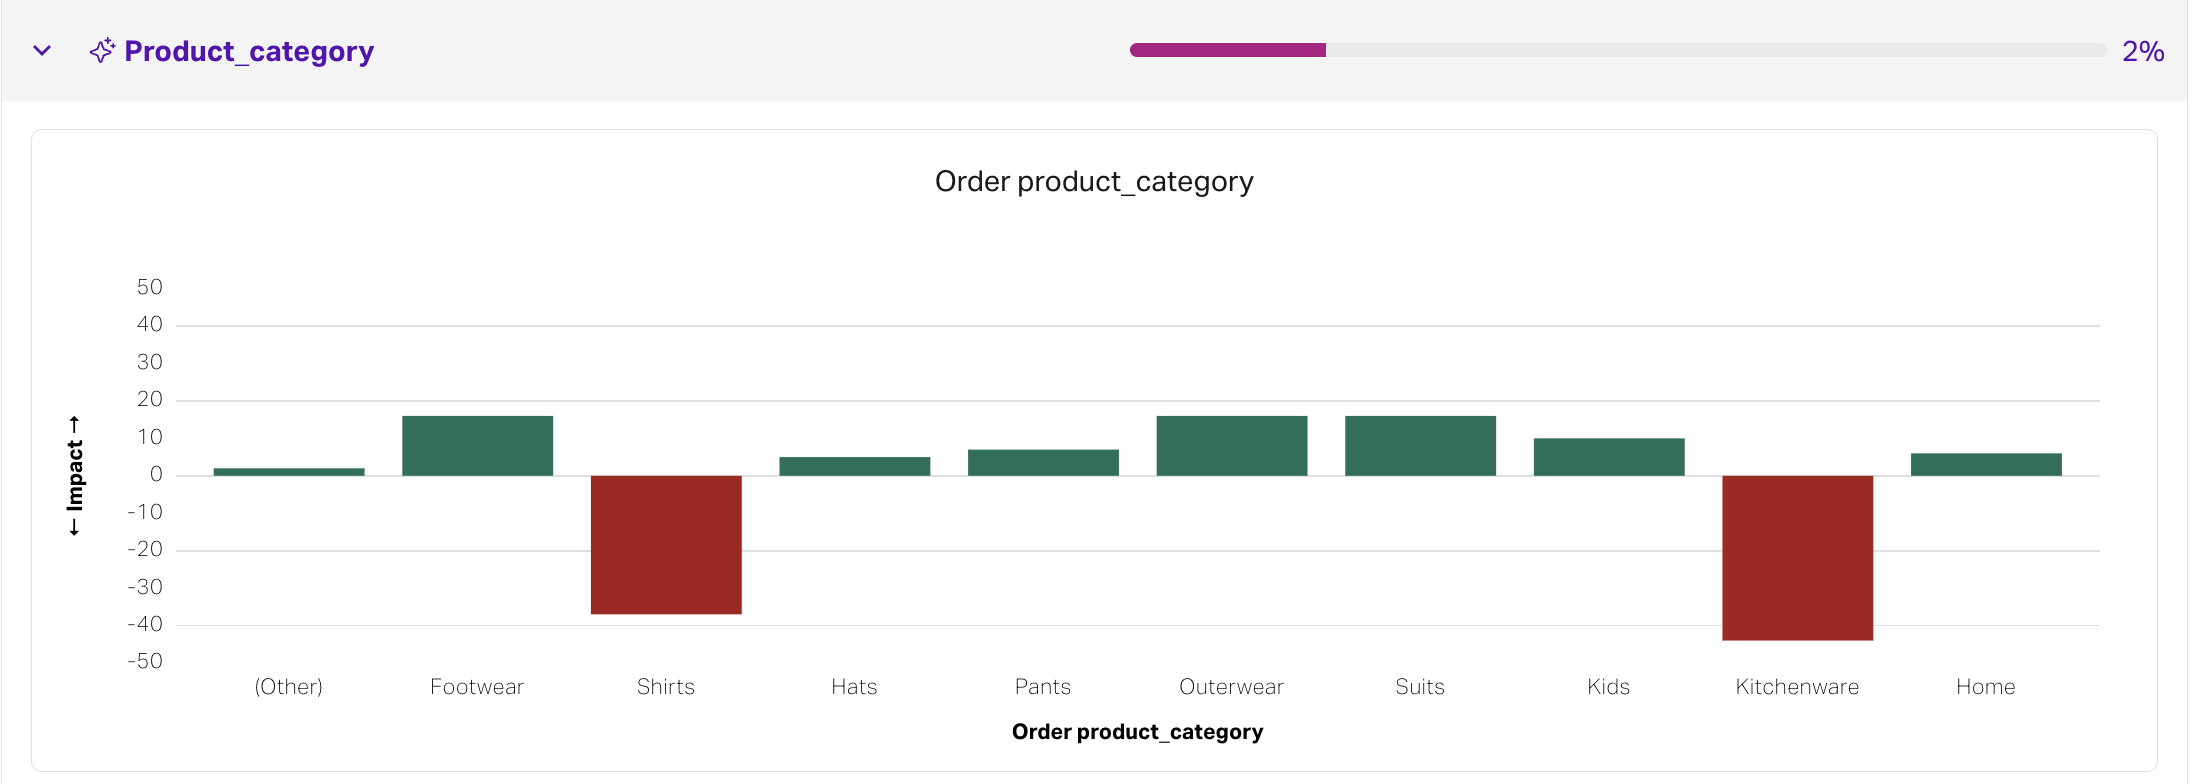
In the above example, items from the "kitchenware" category are less likely to be recommended, and those from the "outerwear" category are more likely to be recommended.
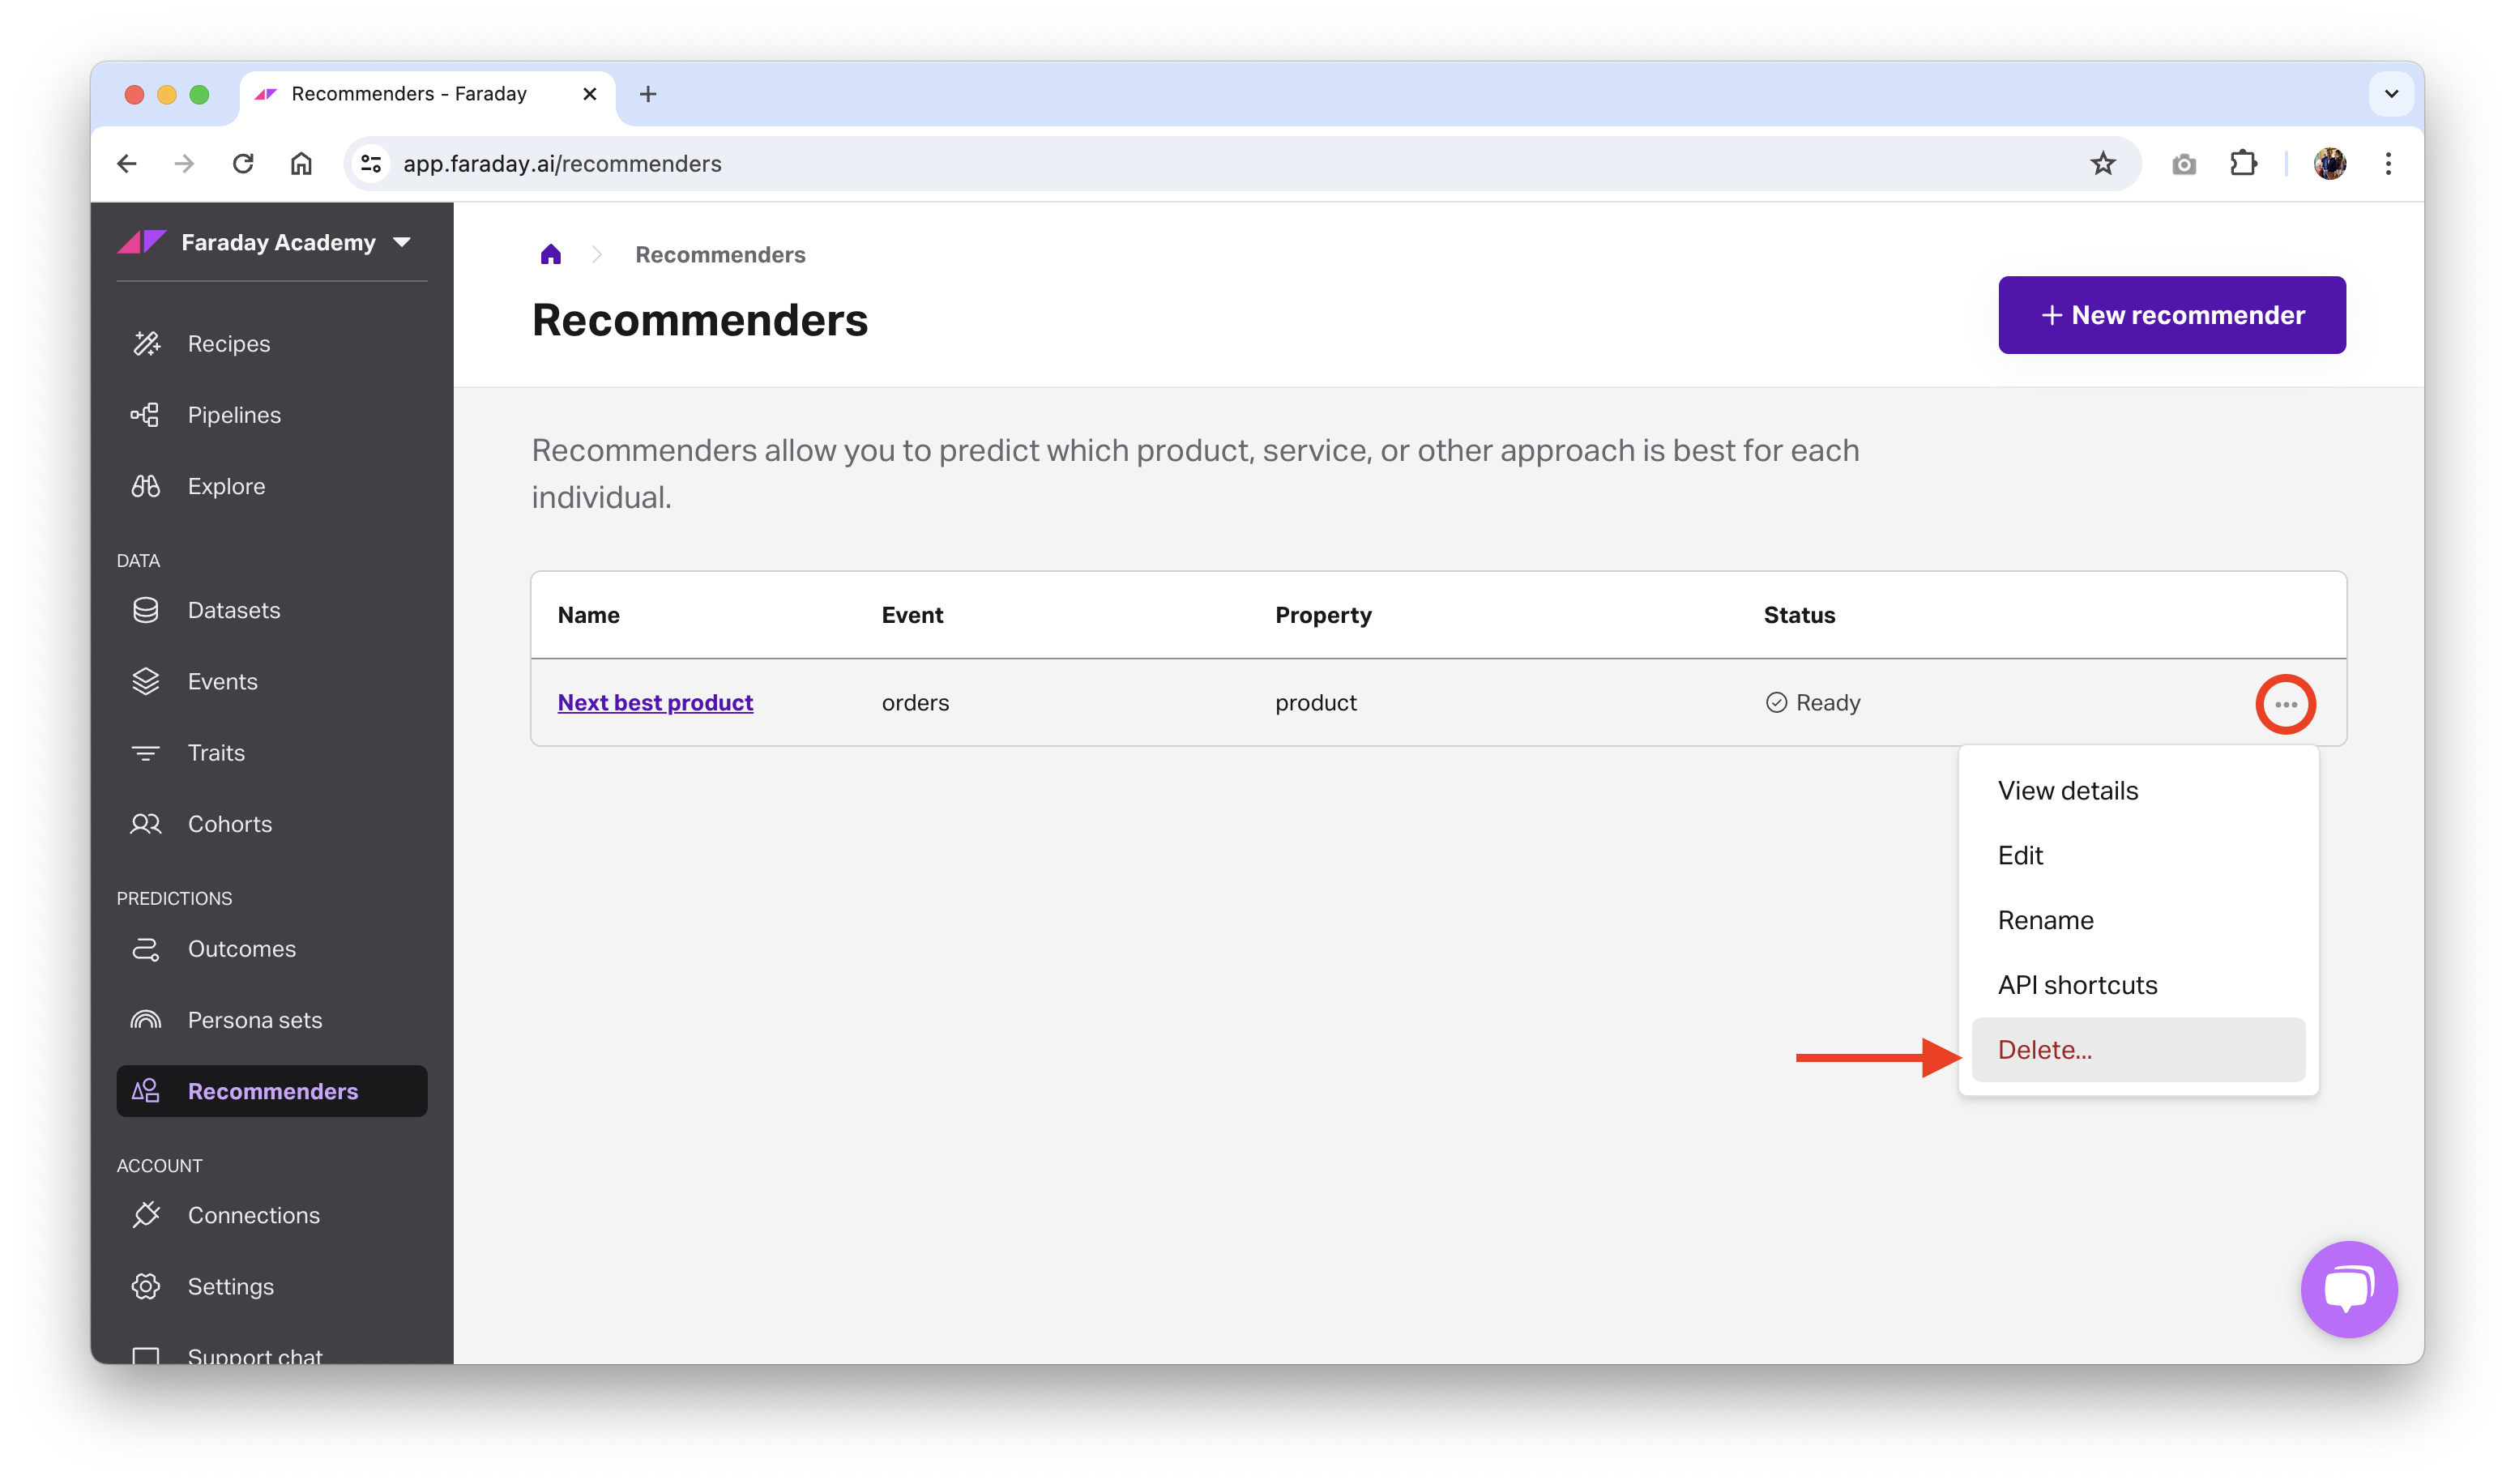
Deleting or archiving a recommender
Before deleting a recommender, ensure that any resources using it, such as a pipeline, have first been deleted. Once there are no pipelines using the recommender, you can safely delete it.
- Dashboard: click the options menu (three dots) on the far right of the recommender you'd like to delete or archive, then click the relevant option, or upper right when viewing a pipeline, then click delete.
- API: use the delete recommender or archive recommender API requests.
📘Deleting and archiving resources
See object preservation for more info on deleting and archiving resources.