Transparent predictive model reporting with Faraday
From at-a-glance performance reporting to feature importances with directionality to in-depth technical reporting, Faraday helps you understand the models we build.


AI is everywhere. Businesses of all kinds are using it for every use case imaginable. From creating copy for their emails or website, to generating graphics for their blog, to predicting customer behavior and beyond. While using AI for the more innocuous cases like brainstorming ideas or generating art tends to leave you with the set-it-and-forget-it mentality, that’s not the case in the realm of predicting customer behavior. Here, explainable AI is critical in helping non-data scientists understand what data your predictive models used to come to their conclusions, and whether or not you can trust them.
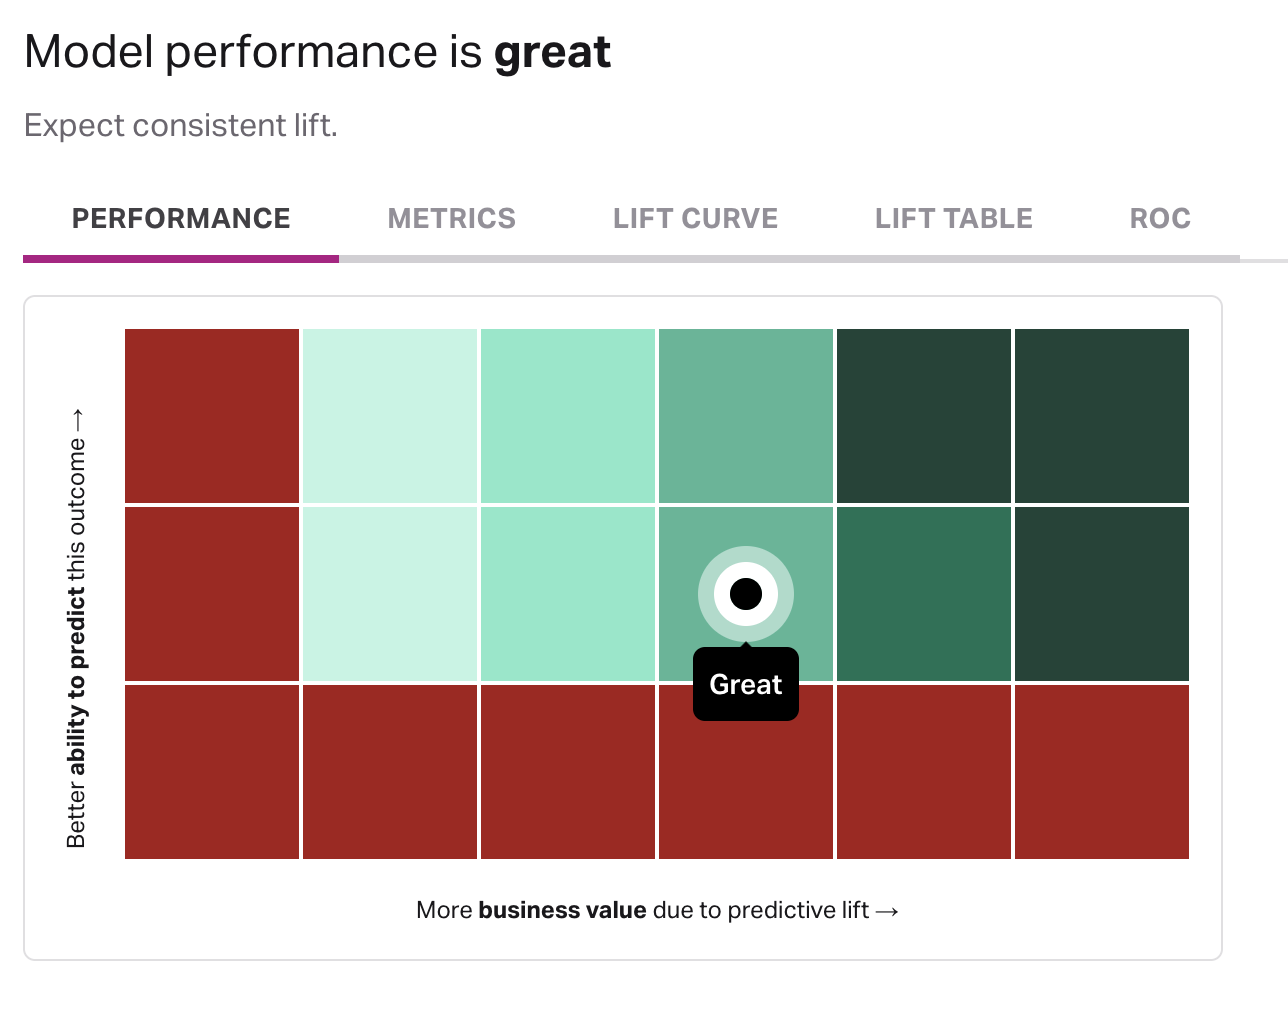
For this reason, every model in Faraday comes with at-a-glance performance reporting so that you can quickly assess how strong your predictive model is. Beyond this, you can dig into things like feature importances and directionality to see what individual features from the Faraday Identity Graph and your own data had the greatest impact in creating the predictive model, and even where specifically within those features they had such impact. Additionally, reporting on ROC and lift are included.
On top of this at-a-glance reporting, each model comes with a complete, in-depth technical report that digs into the nitty-gritty that data scientists love - from analysis of training data to model calibration, cross-validation, and more. Further, Faraday strongly believes in Responsible AI, which means that this technical report also includes score explainability and background on how Faraday came to the conclusion of its bias and fairness assessments.
Don’t just trust us (or any other AI that you use!) - our reports speak for themselves.

Faraday
Faraday is a predictive data layer that helps brands and platforms understand who their customers are and what they’re likely to do next. We connect first-party data with privacy-safe U.S. consumer context from the Faraday Identity Graph and deliver production-ready predictions and datapoints you can activate across marketing, sales, and customer journeys.

Ready for easy AI?
Skip the ML struggle and focus on your downstream application. We have built-in demographic data so you can get started with just your PII.
