How to interpret recommenders in Faraday
A short guide on how to interpret your predictive recommenders in Faraday.


At Faraday, we’re on a mission to help businesses of all kinds predict customer behavior. Whether you’re a credit union that wants to predict the next best offer for your current customers, a construction brand looking to increase lead conversion rates, a sales platform set on enhancing your product with customer predictions to increase rep efficiency–or anything in between–we’ve got you covered.
While we’ve taken great leaps in the 10+ years since our founding to make this type of data science more accessible to non-data-scientists, we know that it can still be a struggle to interpret what exactly you should pay attention to within your outcomes and recommenders so that you can use your customer predictions with maximum effectiveness.
To this end, let’s take a quick look at an example of the output of a recommender and highlight the exact pieces of info you can focus on so that you can understand how to activate on your predictions. For outcomes, check out our accompanying blog post.
Understanding AROOP
A recommender’s metrics tab will show you the average rank of observed property (AROOP), which represents the average ranking of the true next event during training. In other words, the average number of recommendations it took to recommend the correct actual behavior.
What’s an observed property? Many brands use a Faraday recommender to identify the so-called “next best offer.” In this scenario, the event would be “transaction” and the property would be “product.” A recommender’s job is to predict which product property will occur in the person’s next transaction.
Let's look at an example for a fruit seller. In the below table, John's actual behavior landed in one of the "top 2" recommendations from Faraday, while Jane's was in the top 1! The overall AROOP for the recommender would be the average of these ranks: (2 + 1) / 2 = 1.5.
| Name | Recommendations | Observed property |
|---|---|---|
| John |
| Orange |
| Jane |
| Kiwi |
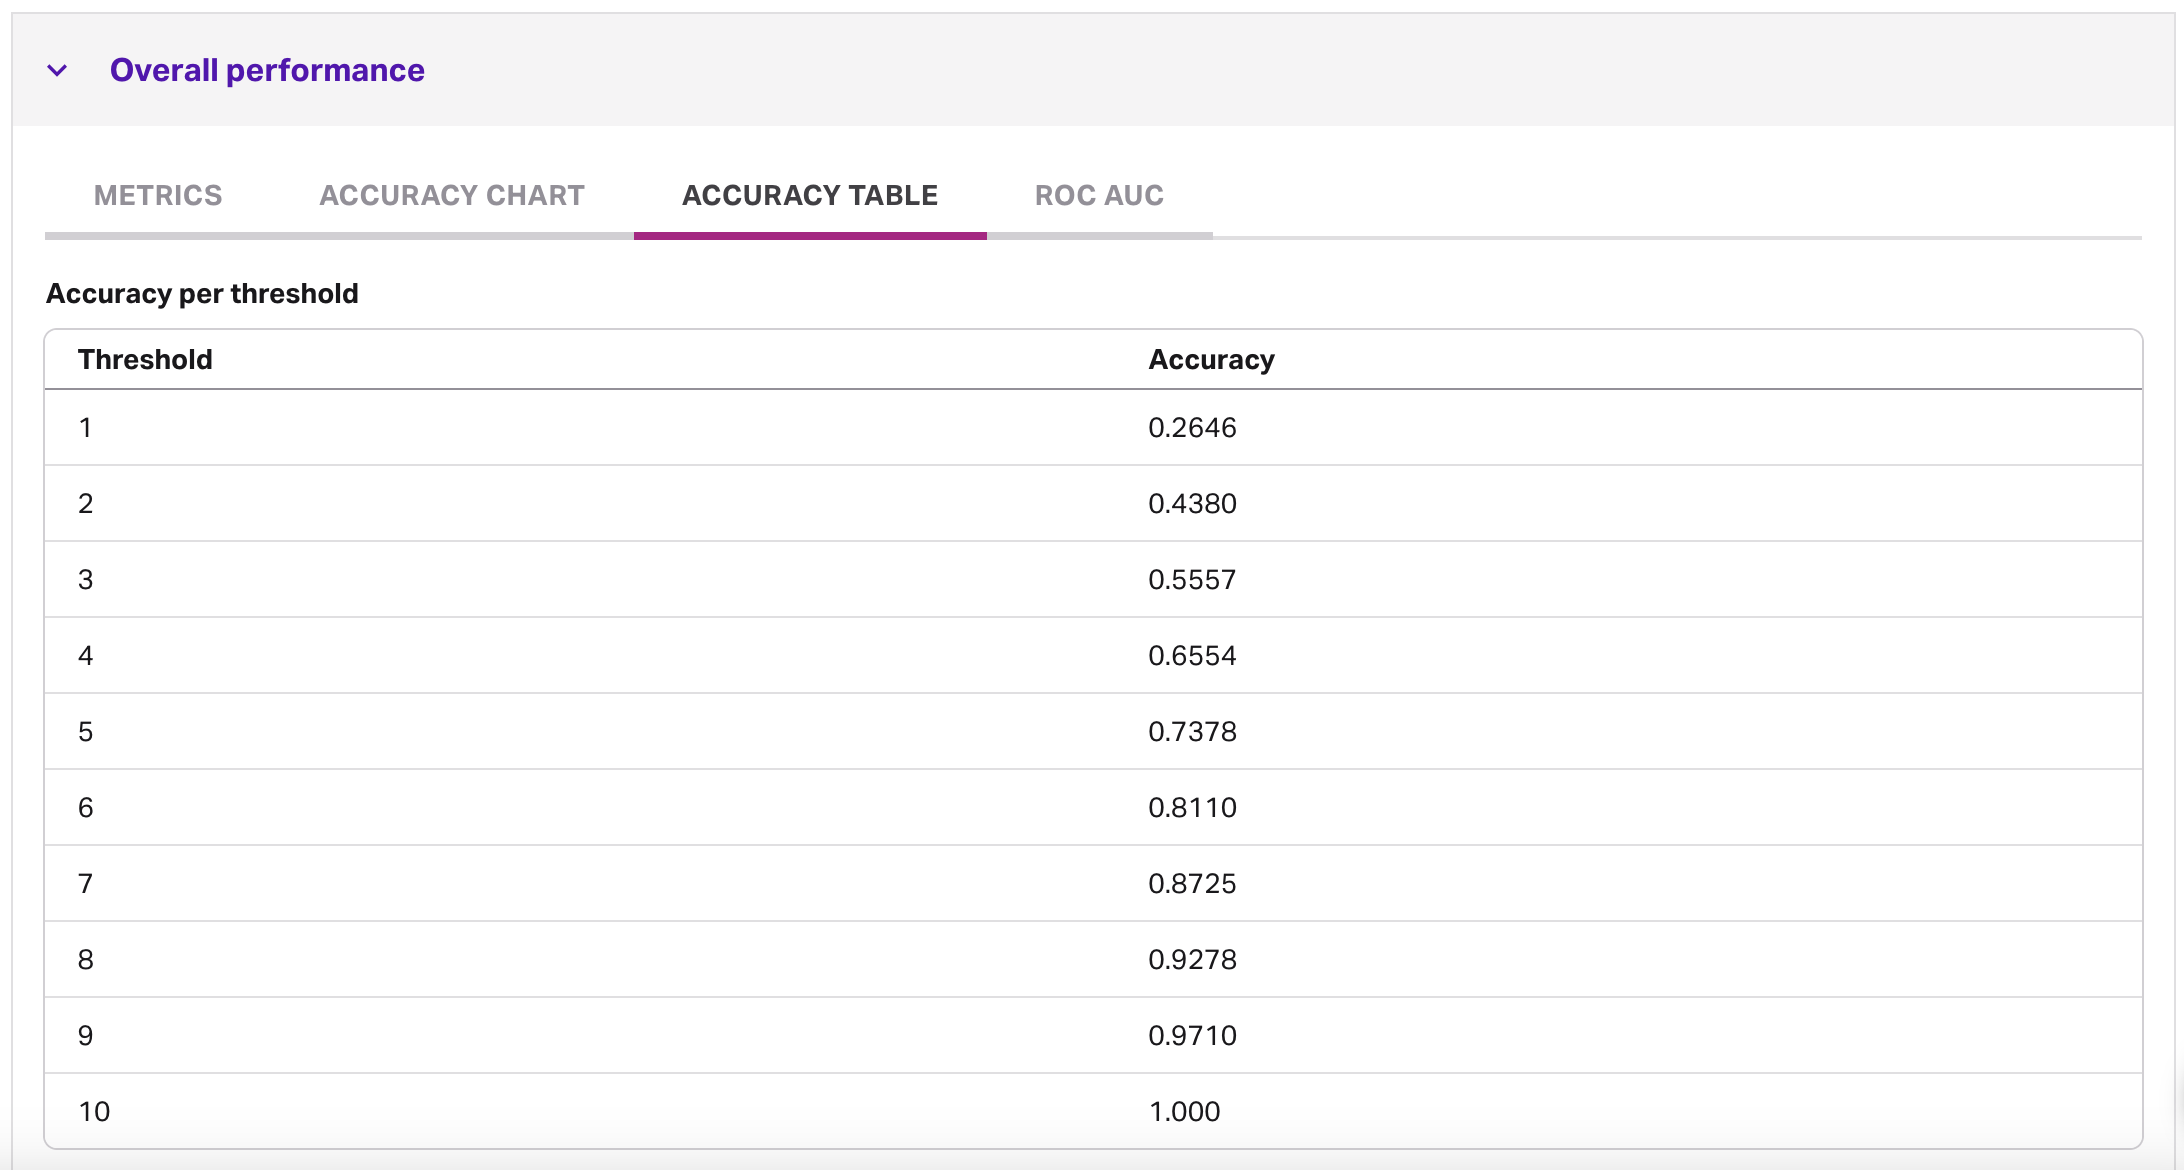
Using the accuracy table
Looking at a recommender’s accuracy table, accuracy refers to how often the observed property is contained in the “top X” recommendations.
For example, if the accuracy for a threshold of 3 is 0.56, then this Faraday recommender correctly predicts the observed property to be in the top 3 recommendations 56% of the time.
Depending on your use case and the medium you're using recommendations in, you can use accuracy up to the appropriate threshold that makes sense for that medium. Choosing the threshold is the equivalent of finding the balance between the accuracy of the recommendation and overwhelming information. If you recommend everything to the customer, you're guaranteed that their next action will be one of your recommendations, but that's not very helpful!
If you want to take a deeper look at how each trait (feature) impacted your predictive models, check out our blog on understanding model reports.
Andy Rossmeissl
Andy Rossmeissl is Faraday’s CEO and leads the product team in building the world’s leading context platform. An expert in the application of data analysis and machine learning to difficult business challenges, Andy has been running technology startups for almost 20 years. He attended Middlebury College and lives with his wife in Vermont where he lifts weights, makes music, and plays Magic: the Gathering.

Ready for easy AI?
Skip the ML struggle and focus on your downstream application. We have built-in demographic data so you can get started with just your PII.