All blog posts
Product
Getting started with Faraday
What’s in a deployment? How to read your Faraday outputs
This guide walks through every component of a Faraday deployment—scores, personas, traits, cohorts, and more—so you can turn raw predictive outputs into strategic, actionable insights.


David Small &
Ben Rose
on
This post is part of a series called Getting started with Faraday that helps to familiarize Faraday users with the platform
“So what do we actually get from Faraday? Is there some kind of Excel file I can open, with all the data points laid out in plain English?” - Your CEO in your 1-on-1.
Sound familiar? In this post we want to help you communicate to your leadership what they can expect the Faraday system to provide them, enabling the marketing and product workflows of their dreams.
Faraday is often used to optimize outreach (through use cases like lead scoring and personalization), helping teams identify which people are most likely to take meaningful action and tailor their communication to them. But the output you get includes much more than just a score. It’s a full snapshot of each person or household in your audience: scores, traits, behavioral segments, and cohort tags.
This post breaks down exactly what you'll find in a Faraday deployment, and how to use each piece to drive smarter strategy and communication across the funnel.
Outcome scores: the two numbers that tell the story
This section refers specifically to outcome models—predictions like “which of my leads are most likely to purchase,” “who will respond to outreach,” or “who’s at risk of churn.” These are the most common prediction types in Faraday, and they return two scores per person.
Every outcome prediction in Faraday includes:
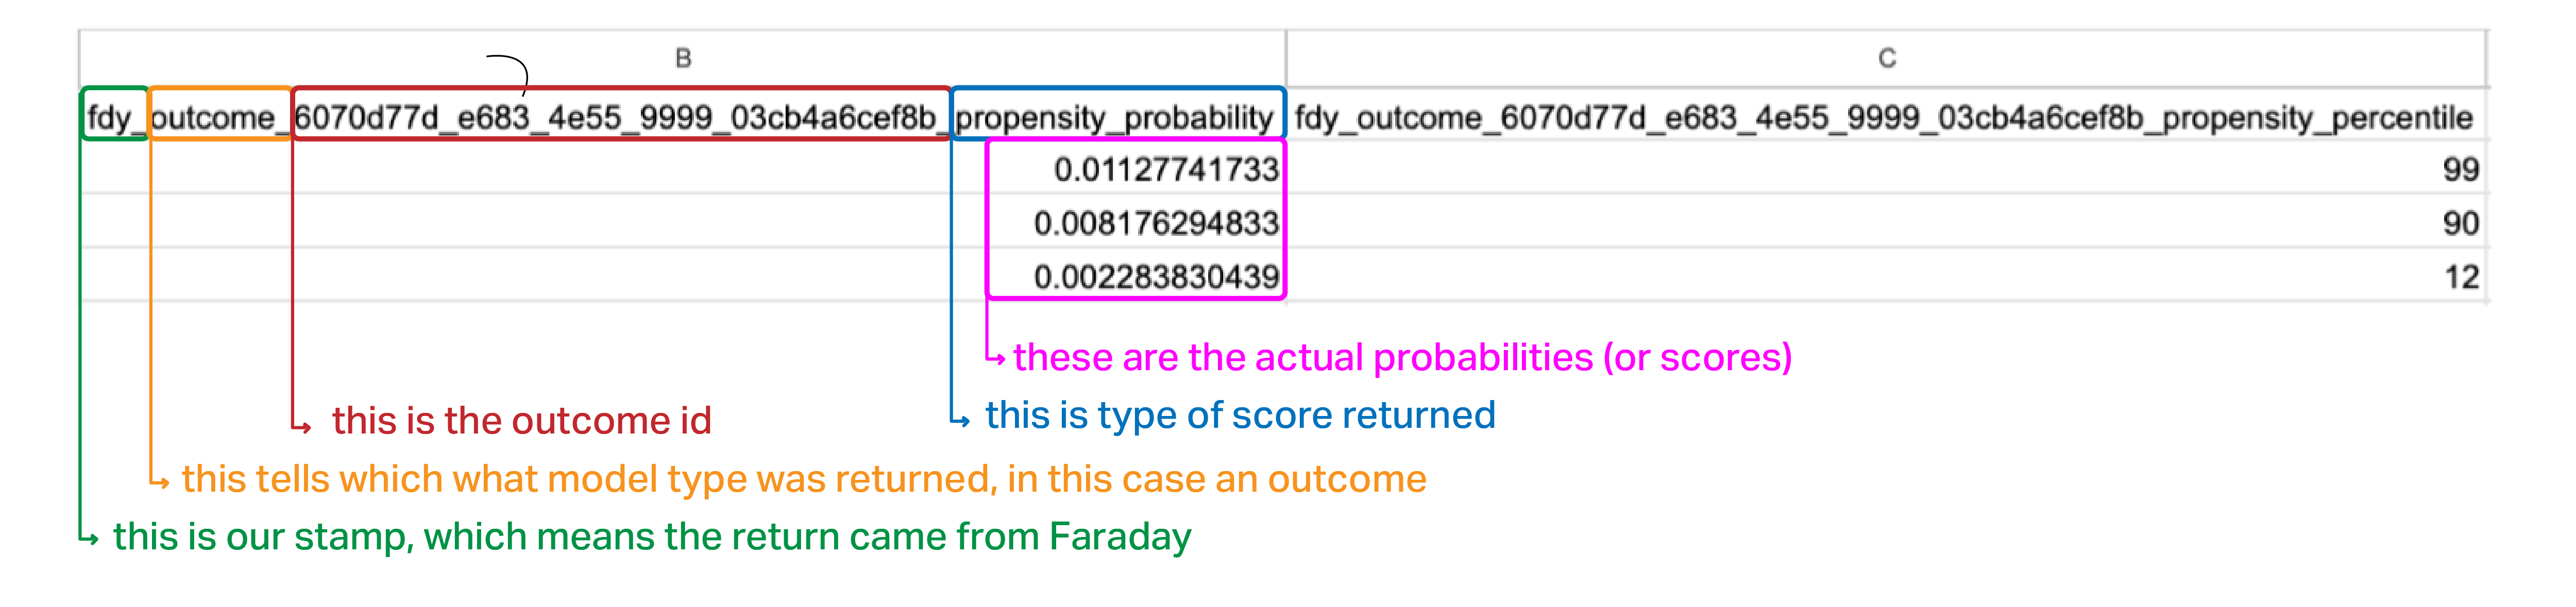
- Propensity percentile: how this person ranks compared to everyone else in your prediction population. For example, a 95th percentile means they’re more likely to convert than 95% of people in the group.
- Propensity probability: the actual chance this person will take the action you care about. For instance, a 0.72 means a 72% likelihood of conversion.
If the percentile helps you prioritize, the probability helps you forecast. Together, they give you both a ranked list and a sense of real-world likelihood.
In this post, we’re using a CSV file as the example format for clarity, but keep in mind, the structure and content of a Faraday deployment is the same no matter how you receive it—whether via data warehouse, API, or direct integrations.
But regardless of where you get this information, we know that all this information can feel a bit overwhelming at first. While our support team is always here to help you make sense of your results, we’ve broken things down below to give you a head start.
Below is an example of an output that you could expect to see when you request a probability or propensity outcome. These returns can look a little intimidating if you haven’t read one before so let's break down what you’re looking at.
A much more detailed breakdown of propensity vs. probability is explained in our previous blog, Propensity vs probability: Understanding the difference between raw scores and probabilities, written by one of our incredible data scientists, Thibault Dody. If you'd like a more detailed explanation of how these scores are calculated and when to use them, check that one out!
Recommender outputs: ranked predictions across many options
While outcome models predict whether someone will take a specific action, recommender models answer a different kind of question: “Which of these options is best for this person?” Rather than producing percentiles or probabilities, they focus on relative ranking, helping you surface the best match for each person from a set of options.
For example, a recommender might tell you which product a customer is most likely to purchase, or which offer will resonate most. Instead of returning a single score, these models return a ranked list of options for each person, based on predicted likelihood.
In a typical recommender output, you’ll see:
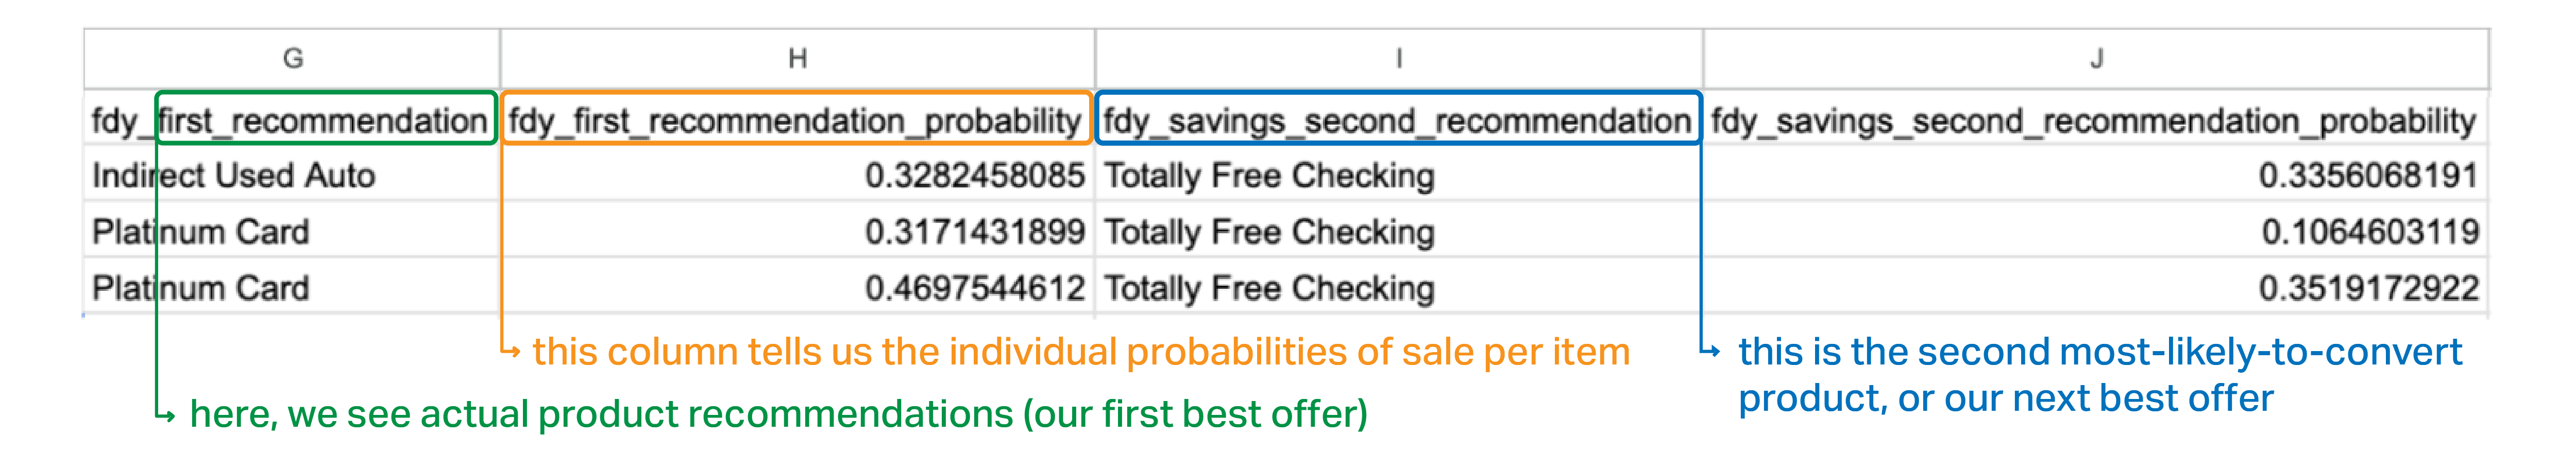
- A list of recommendations (e.g., products, offers, messages)
- A rank indicating preference order
- A relevance score (optional), showing how strong the model’s confidence is
You can use these outputs to power personalized product recommendations in email or on your website, route individuals into different messaging tracks based on their attributes or behavior, and dynamically customize the content or offers they see to create a more relevant and engaging experience. This kind of real-time personalization can significantly boost conversions and improve lifetime value!
Here, we get to see an example of a recommender model return:
Personas: behavioral context you can act on
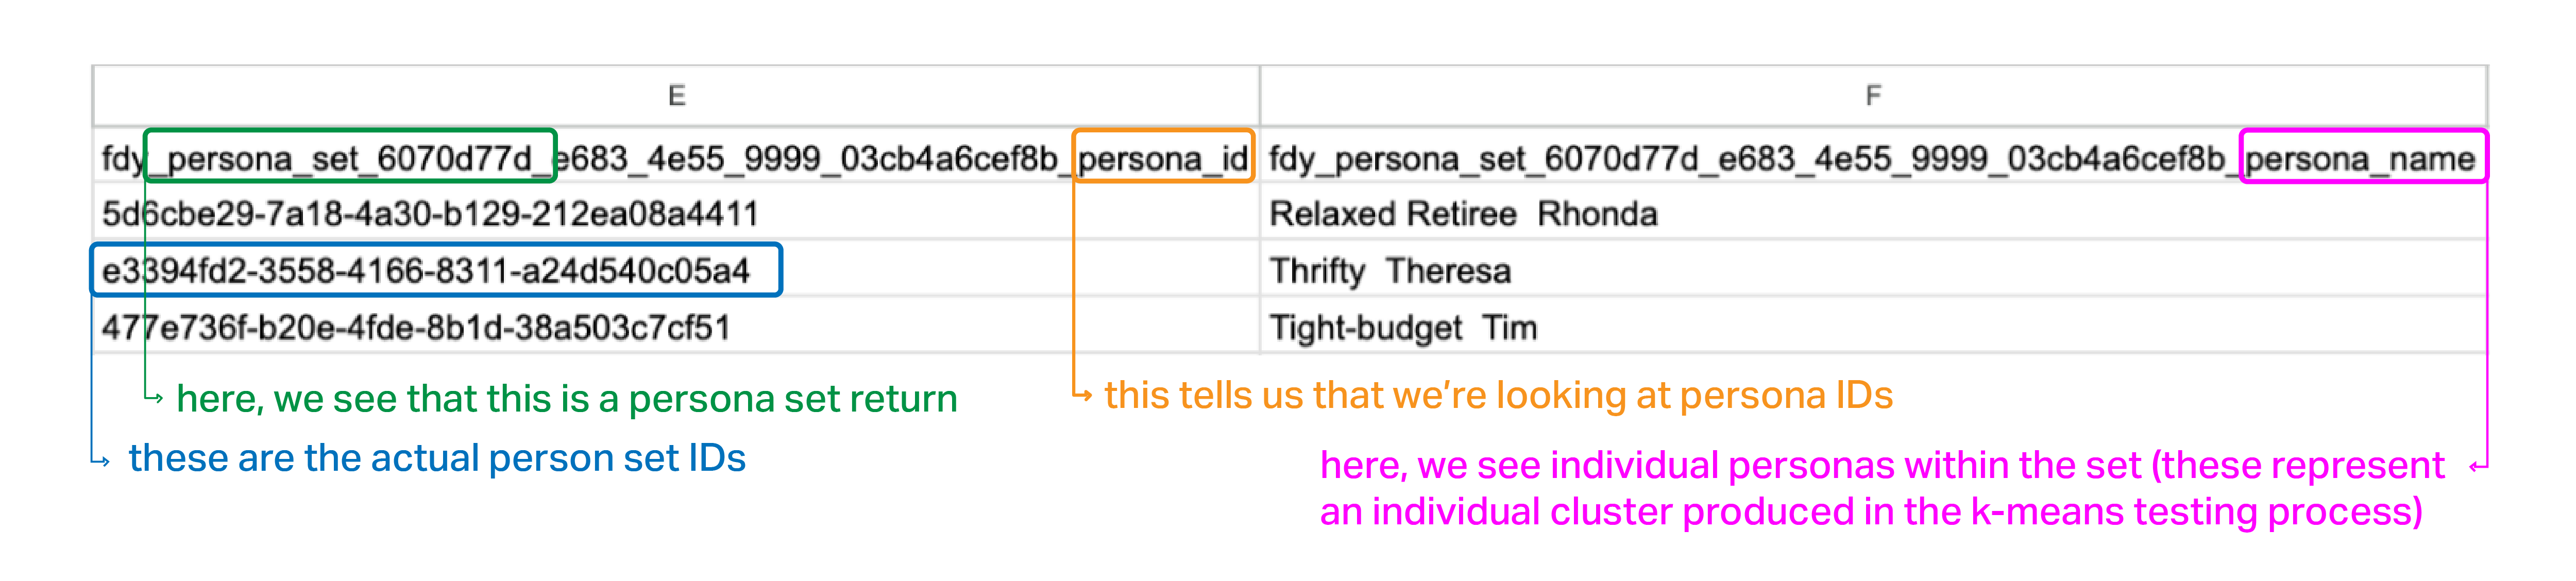
Faraday personas are behavioral segments created by clustering your customers based on hundreds of data points. They help you go beyond just knowing who’s likely to act—you get a sense of why they might act, and how to engage them. We build these personas using a k-means clustering process, which groups similar individuals together based on shared traits and behaviors, you can learn more about how it works here.
You can think of a persona as archetypes. An “Eco Enthusiast” might respond well to sustainability-focused messaging, while a “Status Seeker” may prefer premium positioning.
Here’s how you might expect a persona return to look.
Personas also help you:
- Tailor messaging and offers to match motivation
- Pick the right channels, whether that’s social, email, or direct mail
- Inform product and UX decisions based on lifestyle or priorities (e.g. “Busy Parents” value speed and simplicity)
Want to go deeper? Our CEO, Andy, just wrote a whole blog about how personas work, and why they’re the foundation of various other predictive tools.
Traits: the signals behind the scenes
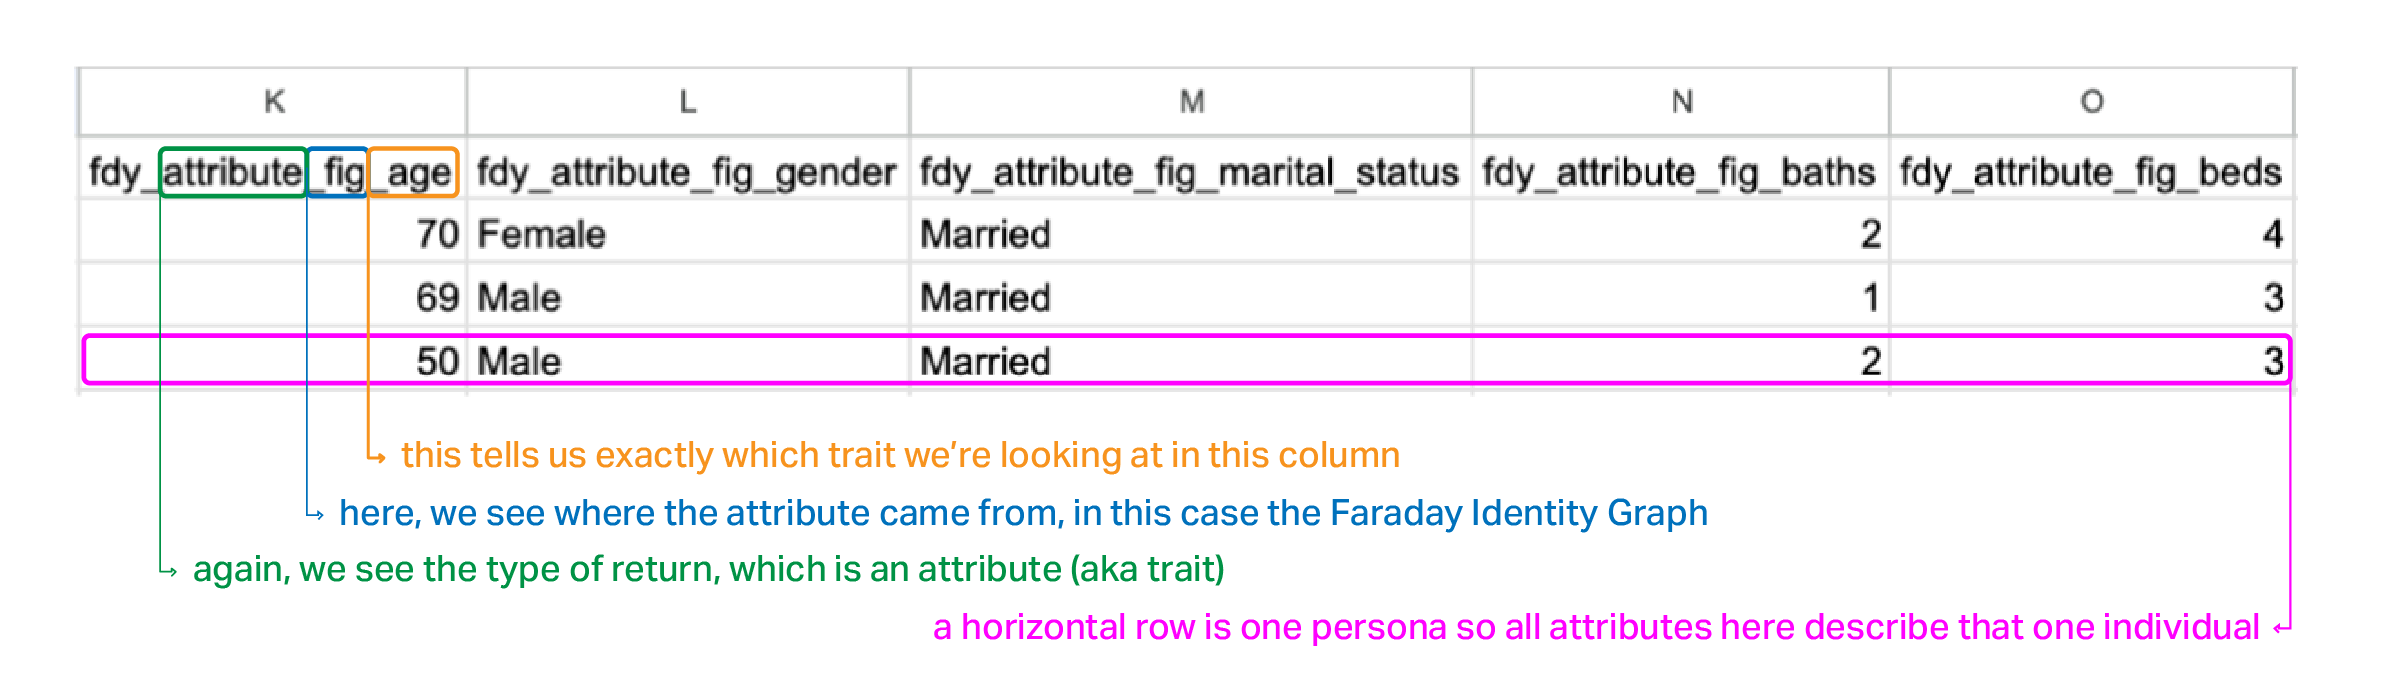
Traits are the demographic, behavioral, and lifestyle characteristics that describe each individual in your prediction results—attributes like age range, income bracket, homeownership status, household size, and more. At Faraday, these traits are powered by our proprietary Faraday Identity Graph (FIG)—a comprehensive, privacy-conscious dataset that includes rich, consent-based attributes on over 240 million U.S. adults and their households. FIG combines data from hundreds of public and commercial sources into a unified identity framework, allowing us to surface actionable insights without requiring you to collect or manage sensitive personal data yourself.
These are the features the model uses to make its predictions. They also help you:
- Filter or sort your results
- Build secondary audiences
- Spot unusual patterns (e.g., "why are so many top scorers renters?")
In short, traits let you peek under the hood. They can explain why someone scored highly—or give you clues about where to dig deeper.
If you’d like to explore the 1,400+ rich consumer traits included by default with every Faraday deployment, take a look here!
Cohort membership: groups you define
Faraday also returns cohort indicators that show whether someone belongs to one of the custom segments you’ve defined—like "Past purchasers," "Subscribers," or "Churn risks."
You can also create cohorts using the data already available within Faraday. For example, you could define a cohort for men between the ages of 21–45 who live in California, Utah, or Nevada. Once created, each person in your population is tagged with a simple true/false value—do they match this cohort or not? That makes these cohorts incredibly useful as boolean filters: you can use them to include or exclude groups from predictions, targeting, or reporting.
Cohort membership helps you:
- Exclude irrelevant groups (like existing customers)
- Compare segments side-by-side
- Layer in your own business logic
- Understand whether a person fits within an important audience segment
If that sounds similar to Personas, there are some critical differences worth calling out:
- Personas are discovered. Faraday generates them by identifying patterns in behavior and demographics across your customer base.
- Cohorts are defined. You create them based on your business rules and goals—like engagement history, purchase frequency, or lifecycle stage.
In other words, Personas reveal who people are; cohorts reflect what they’ve done, who they are, or how your business thinks about them.
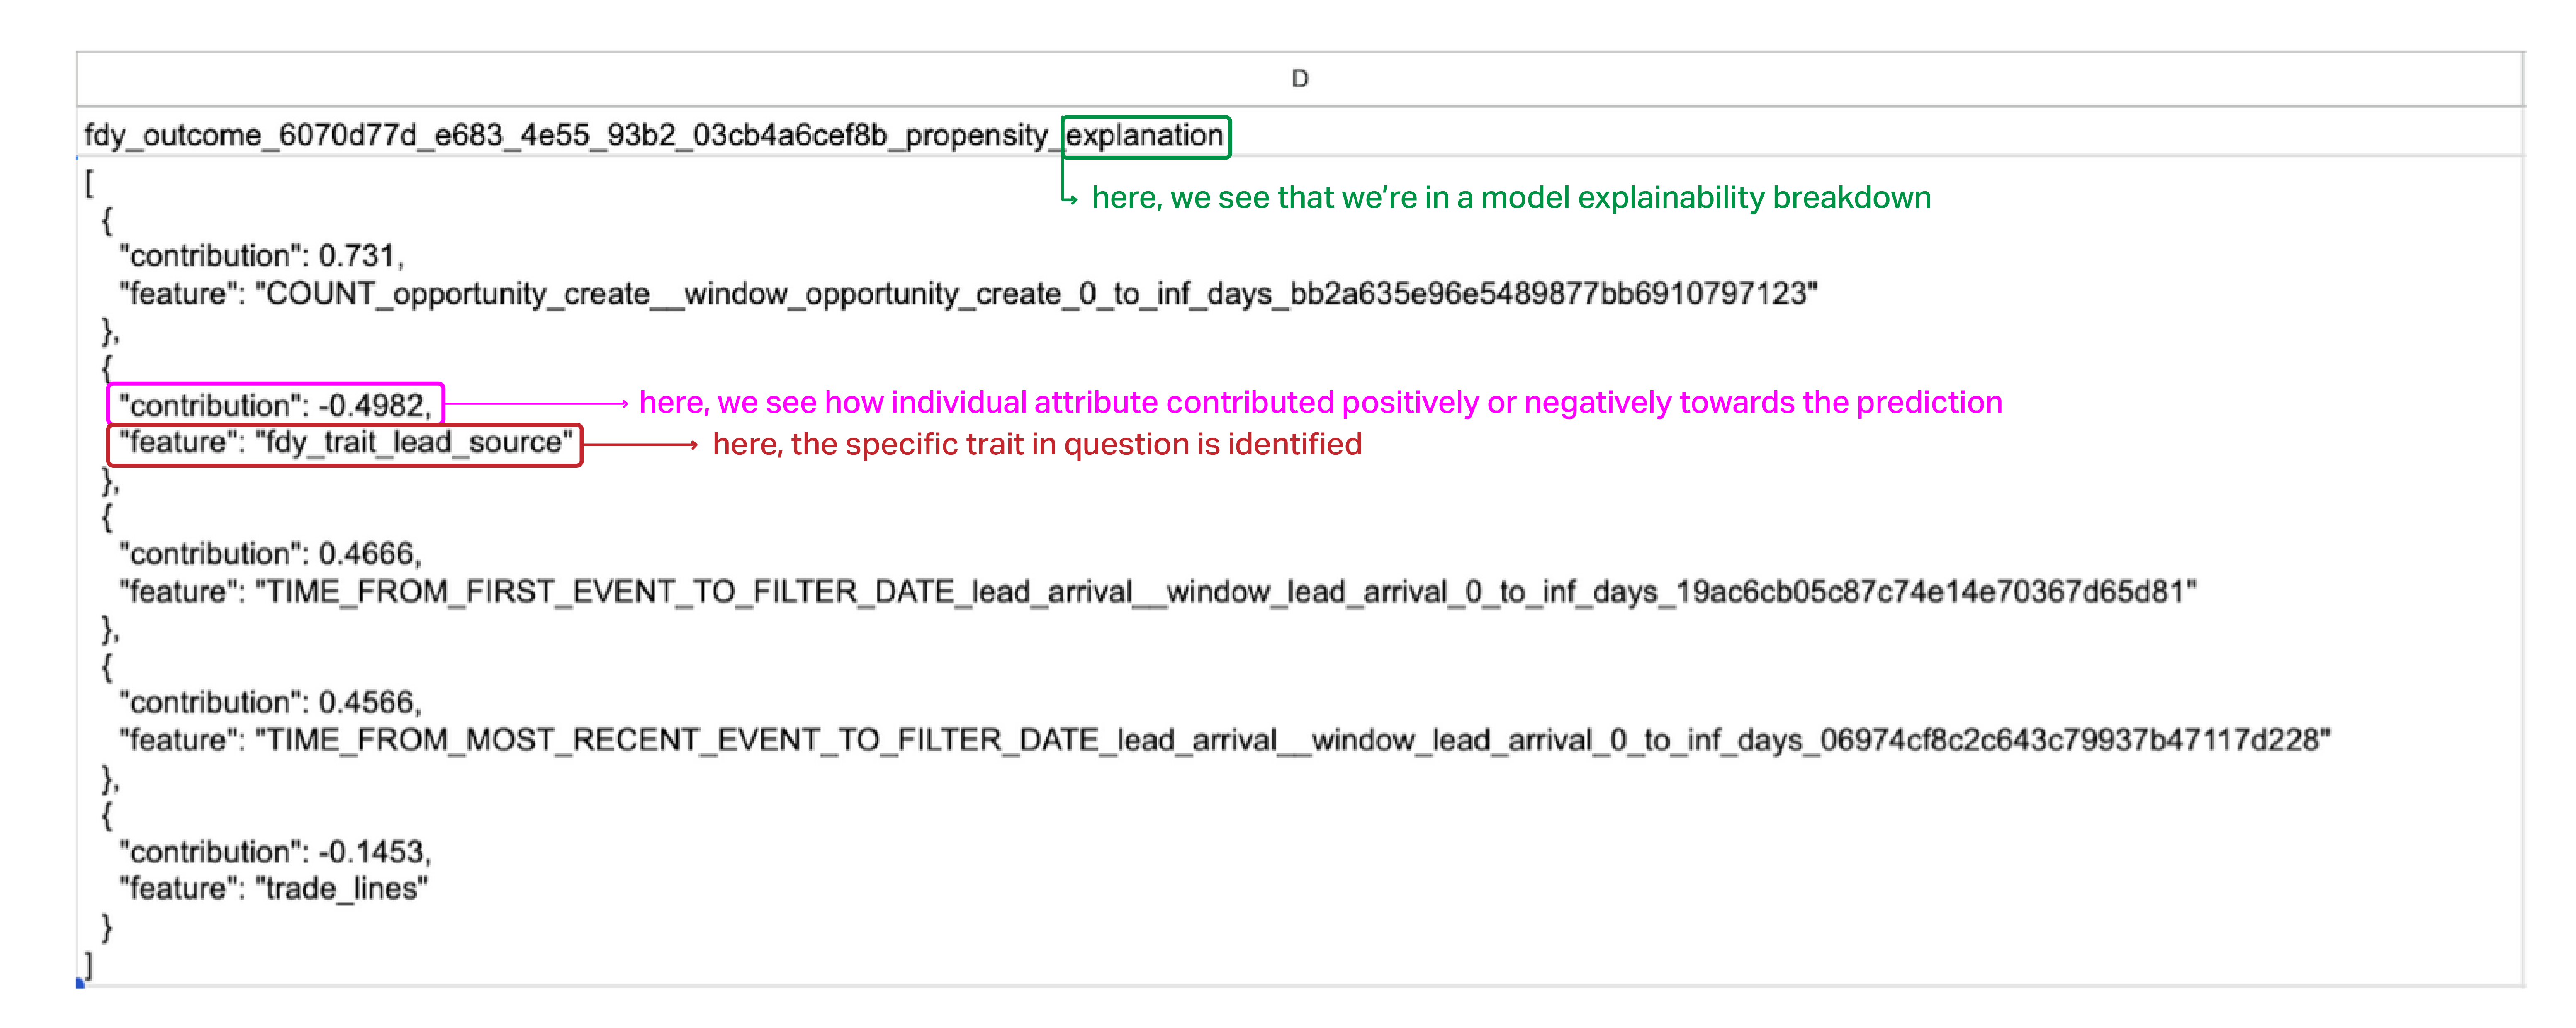
Prediction explanations: why someone scored the way they did
Sometimes, knowing what someone scored isn’t enough—you want to understand why. That’s where prediction explanations come in.
When enabled, explanations provide a breakdown of which traits had the biggest impact on a person’s prediction. You might see that homeownership, household size, or a specific behavioral indicator pushed a score up or down.
These explanations can help your team:
- Sense-check the model's logic
- Find patterns across high or low scorers
- Build trust and transparency into outreach decisions
In short, explanations turn the model from a black box into something you can interrogate and understand. For more detail on how to interpret this output, see the documentation on deployments.
Putting it all together
A raw score can only tell you so much.
Let’s say you know Fred is 40% likely to convert. That’s useful. But it’s limited. Without context, you don’t know who Fred is, what kind of message might resonate with him, or whether he even fits your audience strategy.
Now imagine you have a full output:
- Fred is in the 40th percentile, which means he ranks higher than 40% of your prediction population—and he has a 0.40 probability of converting.
- He belongs to your Newsletter Signups cohort
- He’s assigned to the "Value Shoppers" persona
- He lives in a three-person household earning $50-75k
Suddenly, you’re not just guessing—you’re seeing the full picture. Maybe he’s not your top priority, but his persona suggests he’s responsive to discounts, and he’s already shown interest by signing up for your emails. That’s enough to make a targeted, budget-conscious offer worth testing.
Understanding your outputs turns a single prediction into a story. And stories are what make strategy work. Want to see a real example?
In conclusion
Prediction results from Faraday aren’t meant to sit in a spreadsheet. They’re designed to drive action: better segmentation, sharper messaging, and smarter growth. When you understand what each piece means—scores, personas, traits, cohorts—you can put the full power of predictive AI to work.
Want help interpreting your outputs? Reach out to our team or explore more in the Faraday docs.
David Small
As Head of Sales & Partnerships, Dave develops and executes strategies that emphasize mutual growth for Faraday’s partner ecosystem. He works closely with Faraday’s executive team on finding, developing, and growing new relationships across technology companies, lead generators, and agencies. Dave has spent his career in client facing roles, supporting the rollout of emerging technologies and high-impact marketing campaigns. He earned a BA in Sociology from Middlebury College and is based in Vergennes, Vermont.
Ben Rose
Ben Rose is a Growth Marketing Manager at Faraday, where he focuses on turning the company’s work with data and consumer behavior into clear stories and the systems that support them at scale. With a diverse background ranging from Theatrical and Architectural design to Art Direction, Ben brings a unique "design-thinking" approach to growth marketing. When he isn’t optimizing workflows or writing content, he’s likely composing electronic music or hiking in the back country.

Ready for easy AI?
Skip the ML struggle and focus on your downstream application. We have built-in demographic data so you can get started with just your PII.