Deployments
Deployments (targets in the API) are created in pipelines, and are how you choose where your predictions should go and what they should look like.
Deployments overview
Deployments (referred to as targets in the API) are created within a pipeline, and they determine where your predictions should go–and what they'll look like.
In a deployment, you'll start by choosing where the deployment should go: a connection you've made to a database, data warehouse, cloud bucket, a Faraday-managed connection, or to a CSV file.
From there, you'll choose how the representation format (hashed, referenced, identified, or aggregated), and whether you want the column headers to be machine-friendly or human-friendly. Next, you can either finish the deployment as-is, add deployment filters to ensure only a specific part of the deployment is included, set a limit on the number of rows to include, manipulate the structure to reorganize the data, or make some more advanced changes.
For deployment creation instructions using both the Dashboard UI and API, see the deployment sections of our how-to docs for use cases.
👍Key takeaway: deployments
Deployments–created in a pipeline–determine where your predictions should go, and what they'll look like. You can manipulate what a deployment looks like by choosing its representation format (hashed, identified, etc), adding a filter to focus on a specific part of the deployment (e.g. top 20%), setting a limit on the number of rows (for budgeting or similar concerns), change the structure of the data to fit your needs, and more.
Additional deployment information
Deployments to Faraday-managed connections
Faraday-managed connections can be created to either to pull data from or deploy predictions to other software within your stack, such as an ESP, CRM, or ad platform. They are initiated in connections, and after creating a deployment using a Faraday-managed connections, please create a support ticket so that a Faraday support team member can initiate the deployment on Faraday's side.
Deployment representation
Deployments (targets) can be created in the below representation formats via the Dashboard or the representation parameter in the createtarget API request:
- Hashed (default): Best for deploying audiences to ad platforms. Data is hashed, and not human-readable.
- Referenced: Best for merging data back into your stack. Select the column in your dataset to use as a reference key to merge data back into your stack.
- Identified: Best for direct mail and canvassing campaigns. Data is unhashed and human-readable.
- Aggregated: Best for geotargeted ad campaigns. Select this to see the number of people in each payload element (outcome, persona, cohort) within the area of the geographic type you select.
Deployment column headers
Additionally, you may select whether you'd like machine friendly or human friendly column headers via the Dashboard or the human_readable parameter in the createtarget API request:
- Machine friendly: Best for automated systems where consistent naming is relevant.
- Human friendly: Best for convenient, easy-to-read interpretation. Using human friendly makes your column headers instantly recognizable for what they are by including the outcome name and prediction type. This can help make your predictions easier to identify when deploying to ESPs, CRMs, etc, where you'll want to quickly be able to see a contact's persona or propensity score on their contact card.
Deployment filters
Deployment filters enable you to filter by the persona sets, outcomes, and cohort memberships you selected for your pipeline's payload. This is accomplished both in the Dashboard and the API via the filter parameter in the createtarget API request.
Filtering by a persona set allows you to target specific personas within a persona set, e.g. selecting a persona set and choosing the "equal to" operator on a specific persona, will only include that persona in the deployment.
Filtering by a recommender allows you to choose the highest-ranking recommendations within a given recommender.
Filtering by an outcome allows you to target a percent range of rows by percentile or probability, enabling you to focus on only the people that matter most to you.
-
Percentile indicates where an individual falls, on a scale of 1 (not likely) to 100 (very likely), when compared to the rest of the eligible population scored in your pipeline. For example, an individual whose percentile is 90 is in the top 10% of scorers in the eligible population, with the top 10% of scorers being the most likely to attain the outcome.
- As a second example, if a zipcode's percentile is 50%, that zip is neither more likely nor less likely to have high propensity buyers. If its percentile is 25%, it's less likely to have high propensity buyers.
-
Probability refers to the estimated probability, on a scale of 0 (not likely) to 1.0 (very likely), that the individual will attain the outcome. For example, an individual whose probability is 0.75 has a 75% probability of attaining. Probability is estimated using model calibration (i.e. a 1.0 does not guarantee that the individual will attain).
- As a second example, if 100 people are given a probability to covert of 0.2, then you can expect that, on average, 20 out of the 100 will convert.
📘Further reading: propensity vs probability
For a deep, data-science-heavy dive on Faraday scoring, see Propensity vs probability: Understanding the difference between raw scores and probabilities.
Deployment limits
Deployment limits allow you to specify whether or not you'd like to limit your results by a top count of rows or a bottom count of rows, via the Dashboard and the API via the limit parameter in the createtarget API request. When a pipeline is in preview mode, the limit is locked to 1,000 rows.
- Only the top/bottom (count) enables an exact number of rows to export.
📘Additional limit info
This limit refers only to rows and not necessarily to individuals. For hashed targets in particular, there are likely to be 2-3 duplicate rows per person (one per email and physical address).
📘Large pipelines
For larger pipeline sizes (20M+), the ordering is approximate and may not precisely represent the very top/bottom scoring individuals.
Deployment structure
Deployment structure allows you to rename and reorder columns. Renaming them can make it even more convenient when importing your data into your activation platform. For ad platform deployments like LinkedIn, Facebook, and Google Ads, selecting the appropriate option in the dropdown in Dashboard or custom_structure parameter in the API's in the createtarget API request enables you organize the file in a way that's convenient for upload to that platform.
📘Column naming conventions
Column names don't allow spaces, so if you receive an error when saving, check that you don't have any spaces in renamed columns. Instead of "Faraday propensity score," try "faraday_propensity_score."
Connection-specific
In this last settings option, you'll see format for hosted CSV deployments, or settings specific to the connection if you're deploying back to your database.
📘Advanced settings
These connection-specific settings are only recommended for advanced users and can safely be ignored otherwise.
Understanding deployment columns
A deployment in Faraday will include various points of data about your customers and prospects. When creating a deployment, in the structure section, you can select pre-formatted outputs for various destinations like Facebook, LinkedIn, and Google Ads to save the time & effort of formatting it yourself. In hashed deployments, personally identifiable information (PII) will be replaced by a hash key.
Expand the below tables to see what a deployment will look like.
Hashed, identified, and referenced deployments
| Column name | Definition | Additional info |
|---|---|---|
| row_id | Faraday's internal key. | |
| person_first_name | First name of the individual. | |
| person_last_name | Last name of the individual. | |
| house_number_and_street | Physical address of the individual. | |
| city | City the individual resides in. | |
| state | State the individual resides in. | |
| postcode | Postcode/Zip code the individual resides in. | |
| Email address of the individual in Faraday's data. | ||
| fdy_persona_set_persona_id | The ID of the persona set in which this individual's persona exists (not the persona itself). | |
| fdy_persona_set_persona_name | The name of the persona that the individual belongs to. | |
| fdy_persona_set_outlier | true if this assignment should be considered an outlier. | |
| fdy_outcome_propensity_percentile | Relative rank (0-100) of the individual's score among all values. | See deployment filters for full definition. |
| fdy_outcome_propensity_probability | Estimated probability (0.0-1.0) of the individual attaining the outcome. | See deployment filters for full definition. |
| fig_enrichment_precision | Percent value that Faraday was able to assign traits to an identity. | Individual-level precision includes traits like age and marital status. Residence-level includes traits like home value or number of bedrooms. Region-level includes traits like average commute time or average property tax |
Aggregated deployments
| Column name | Definition | Additional info |
|---|---|---|
| County/metro/state/zipcode | The aggregation level selected when creating the deployment. Can be county, metro, state, or zipcode. | |
| count_fdy_outcome_propensity_percentile | Total number of people in the location based on selected deployment filters. | |
| avg_fdy_outcome_propensity_percentile | Average percentile (0-100) of people in the location. | See deployment filters for full definition. |
| count_fdy_outcome_propensity_probability | Total number of people in the location based on selected deployment filters. | |
| avg_fdy_outcome_propensity_probability | Average probability (0.0-1.0) of people in the location. | See deployment filters for full definition. |
Understanding score explainability
When adding a payload to your pipeline, you can tick the checkbox include prediction explanations to add score explainability your deployments. These explanations detail which traits had the highest impact in calculating each individual's predicted score.
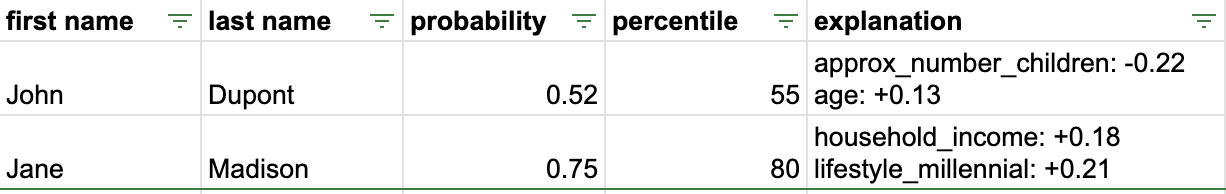
Above, we see an example of CSV output from a pipeline. John is impacted by this outcome’s major factors, age and number of children, and leaves him with a low probability of converting.
Jane, on the other hand, exhibits a more unusual combination of traits that give her a much higher conversion probability for different reasons. For Jane, both her household income and millennial lifestyle saw her conversion probability higher than John because this business often sees conversions from people with those traits–even if they’re not the dominant traits.
Score explainability can help you understand–down to the individual level–what traits in your data are influencing how likely (or unlikely) individuals are of attain your predictive outcomes.
📘Score explainability headers
The above image contains simplified column headers for the sake of this example. Your output might look something like "fdy_outcome_lead_conversion_propensity_explanation" if you select human-friendly column headers, or have a hashed value in place of the outcome name for machine-friendly. Column headers can be edited via the structure advanced setting while configuring a deployment.
Payload fallbacks
When Faraday receives a real-time Lookup API request for an identity it only partially recognizes, it uses a hierarchical fallback strategy to still return meaningful results. Each response includes a match_type field indicating which resolution level was used:
| Match Type | Resolution Level | Description |
|---|---|---|
address_full_name | Person | Exact match to a specific individual |
address_last_name | Household | Data aggregated from individuals with the same last name at the given address |
address_only | Address | Data aggregated from all individuals at the address |
postcode_only | Postcode | Zipcode-level aggregated data |
When address_last_name or address_only match types are used, the response also includes a cohabitants array (up to 10 entries) showing which individuals were used for aggregation.
For full details, see our blog post on payload fallbacks.
Opt-in attribute imputation
By default, Faraday does not use cohabitant and neighbor data to estimate missing attribute values in your target payload. This gives you explicit control over the tradeoff between data coverage and precision.
To enable imputation in Dashboard, check Impute missing attribute values when possible in the new target wizard, or set impute_payload: ["attributes"] on the target's representation via the API. Note that this option is only available for identified, hashed, and referenced representations — not aggregated.
This feature is available for FIG v2 accounts only (all new accounts are FIG v2 by default). It applies to attributes (traits) only — imputation for modeled scores continues to run by default and cannot be disabled.
Enrichment precision
In identified and referenced deployments, an enrichment precision column is included for each trait provider your account is subscribed to. Enrichment precision tells you how well Faraday was able to assign traits to identity information you provided, and is broken down into three levels: individual (person), residence, and region.
Individual (person) enrichment precision means that Faraday is able to assign individual-level traits to an identity, like age, consumer habits, or marital status.
Residence enrichment precision means that Faraday is able to assign address- or property-level traits to an identity, like home value or number of bedrooms.
Region (postcode) enrichment precision means that Faraday is able to assign region-level traits to an identity, like average commute time or average property tax.
Deleting, renaming, or archiving a deployment
- Rename: click the ... menu in the upper right of the deployment card and select rename, or use the
nameparameter in the update a target PATCH request. - Delete or archive (Dashboard): click the ... menu in the upper right of the deployment, then click the relevant option.
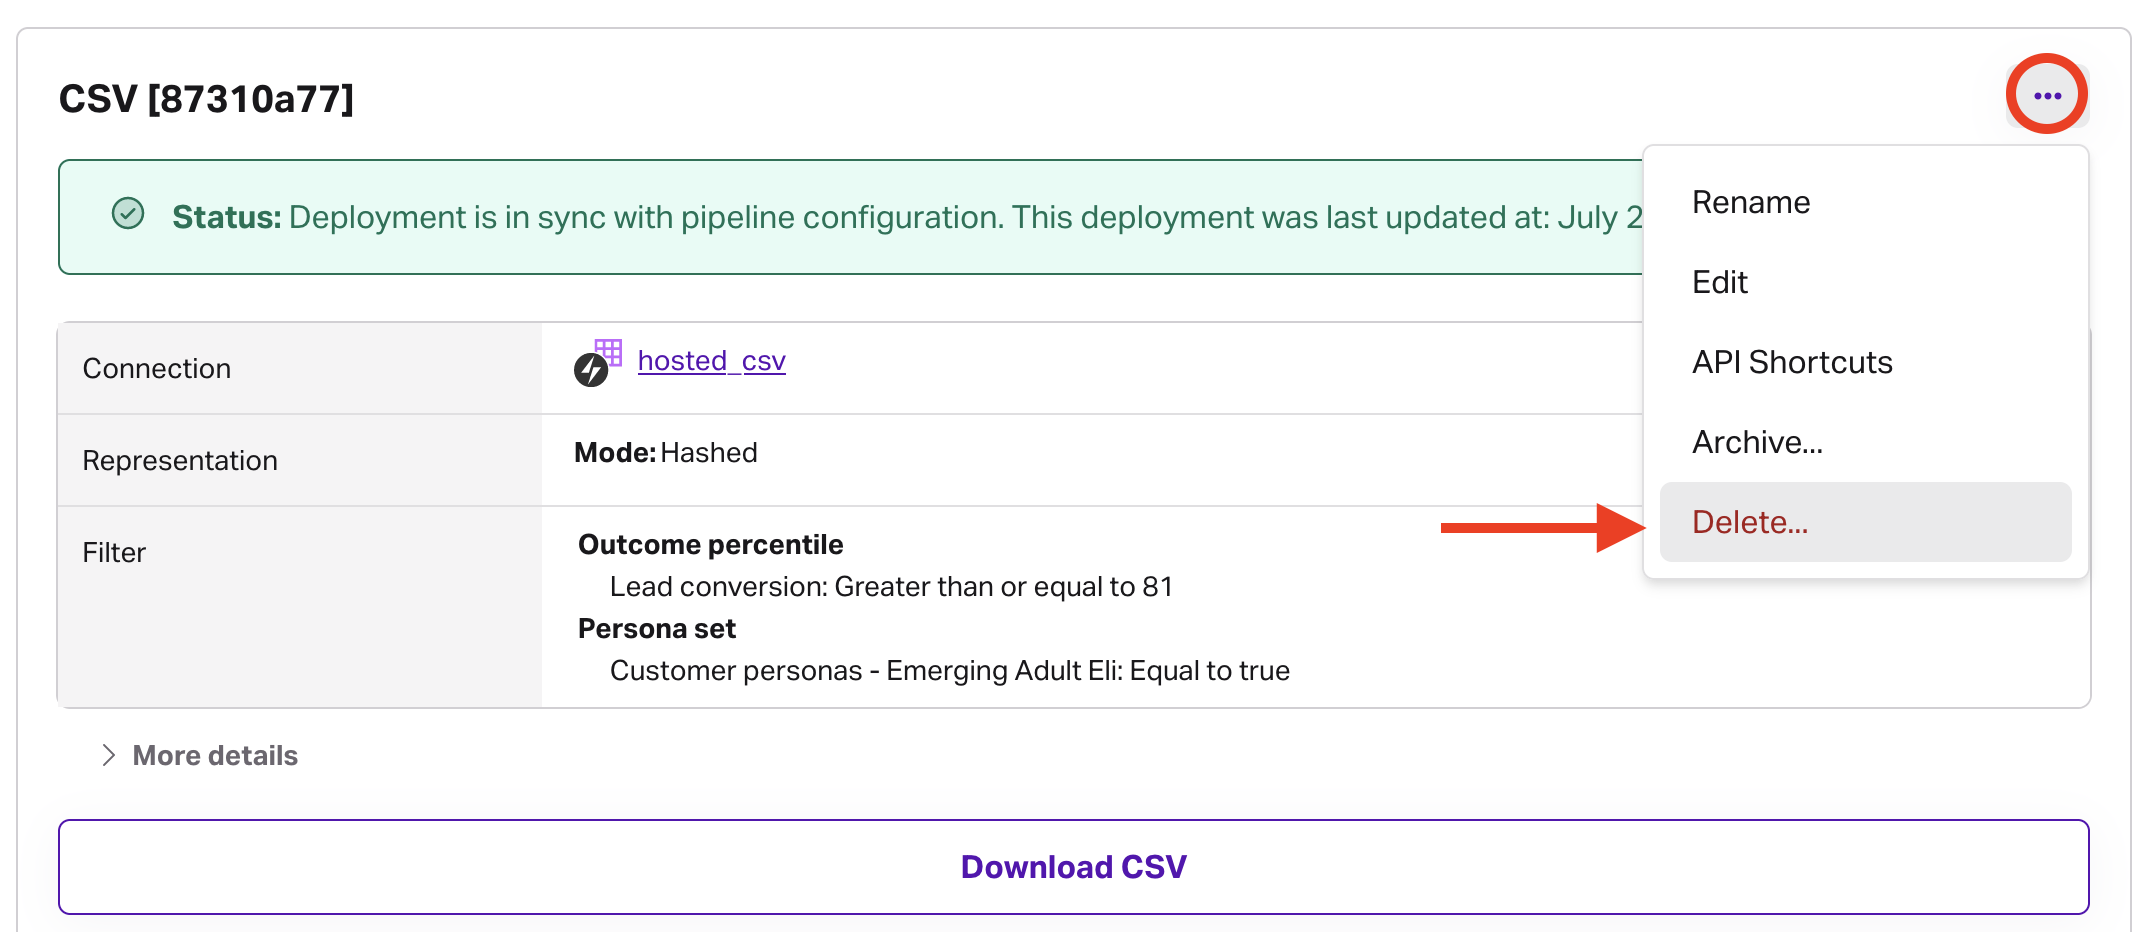
- Delete or archive (API): use the delete target or archive target API requests.
📘Deleting and archiving resources
See object preservation for more info on deleting and archiving resources.
Deployment analysis
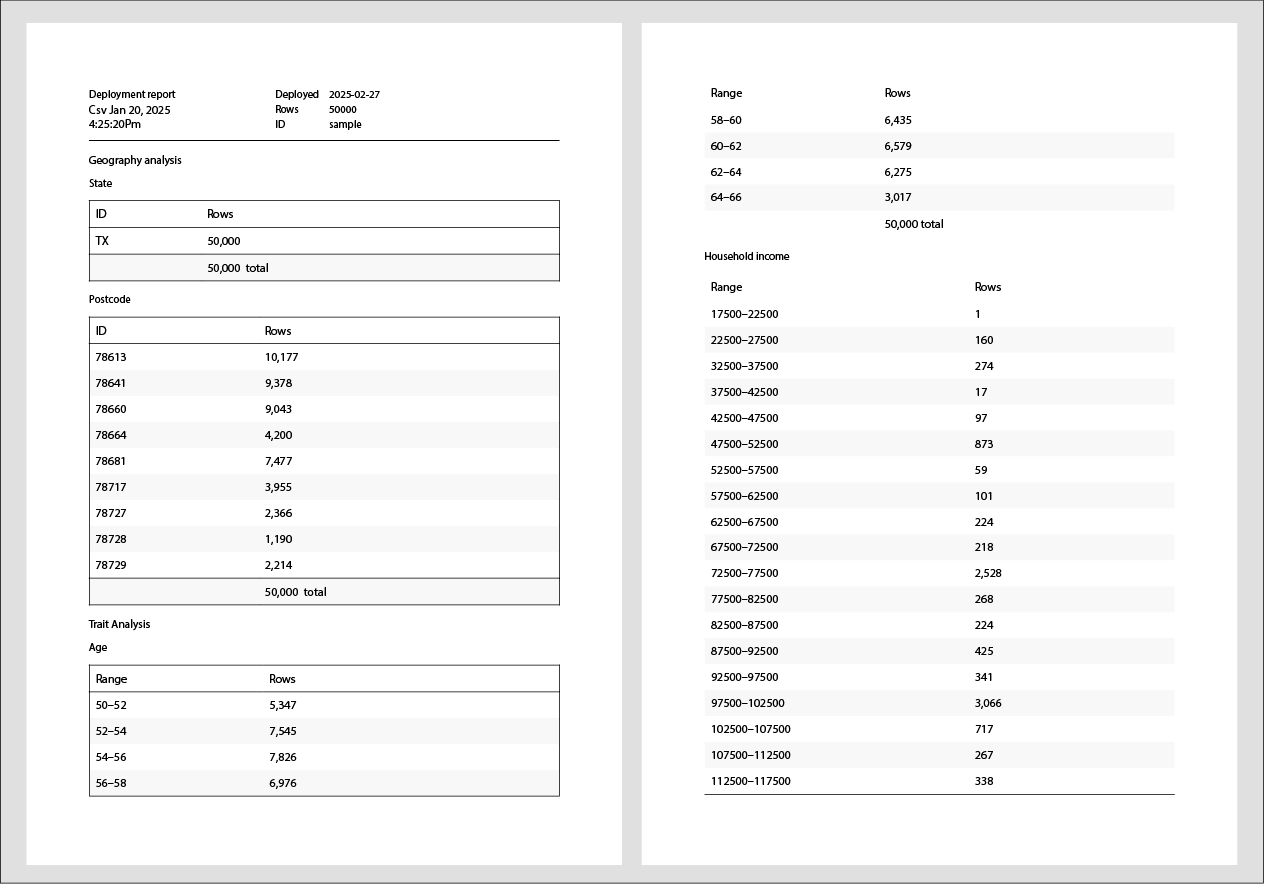
Deployment analysis allows users to summarize key facts about a deployment—including counts, traits, and geo distribution—and generate downloadable PDF reports. These reports provide insight into data distributions and can be accessed both in the Dashboard and via the API (where JSON data is also available).
Marketers can use this feature to identify high-concentration traits and geographies in their lists.
How it works
Users can request deployment analysis by choosing specific traits and/or geography levels (e.g. county, zip) of interest. The system will analyze the distribution of those traits or geographies across the individuals in the deployment and generate a report, which it will refresh monthly. The report will take about as long to generate as it does to build the underlying deployment. While this process does not alter the deployment itself, it provides valuable insights into the data it contains.
Once the analysis is complete, a download button appears in the deployment actions menu and they become retrievable through the API.
📘Accessing traits
Access to traits in the analysis depends on your account’s permissions. Contact your account manager if you’d like to access more traits for this feature.
Here’s a screenshot of an example report. Here, the user has requested the analysis with state and postcode geography levels, as well as age and household_income traits.
Requesting deployment analysis
Users can create an analysis configuration via the Dashboard (UI) or API.
In the Dashboard
- Navigate to the Pipelines section of the dashboard and find the pipeline whose deployment you want to analyze.
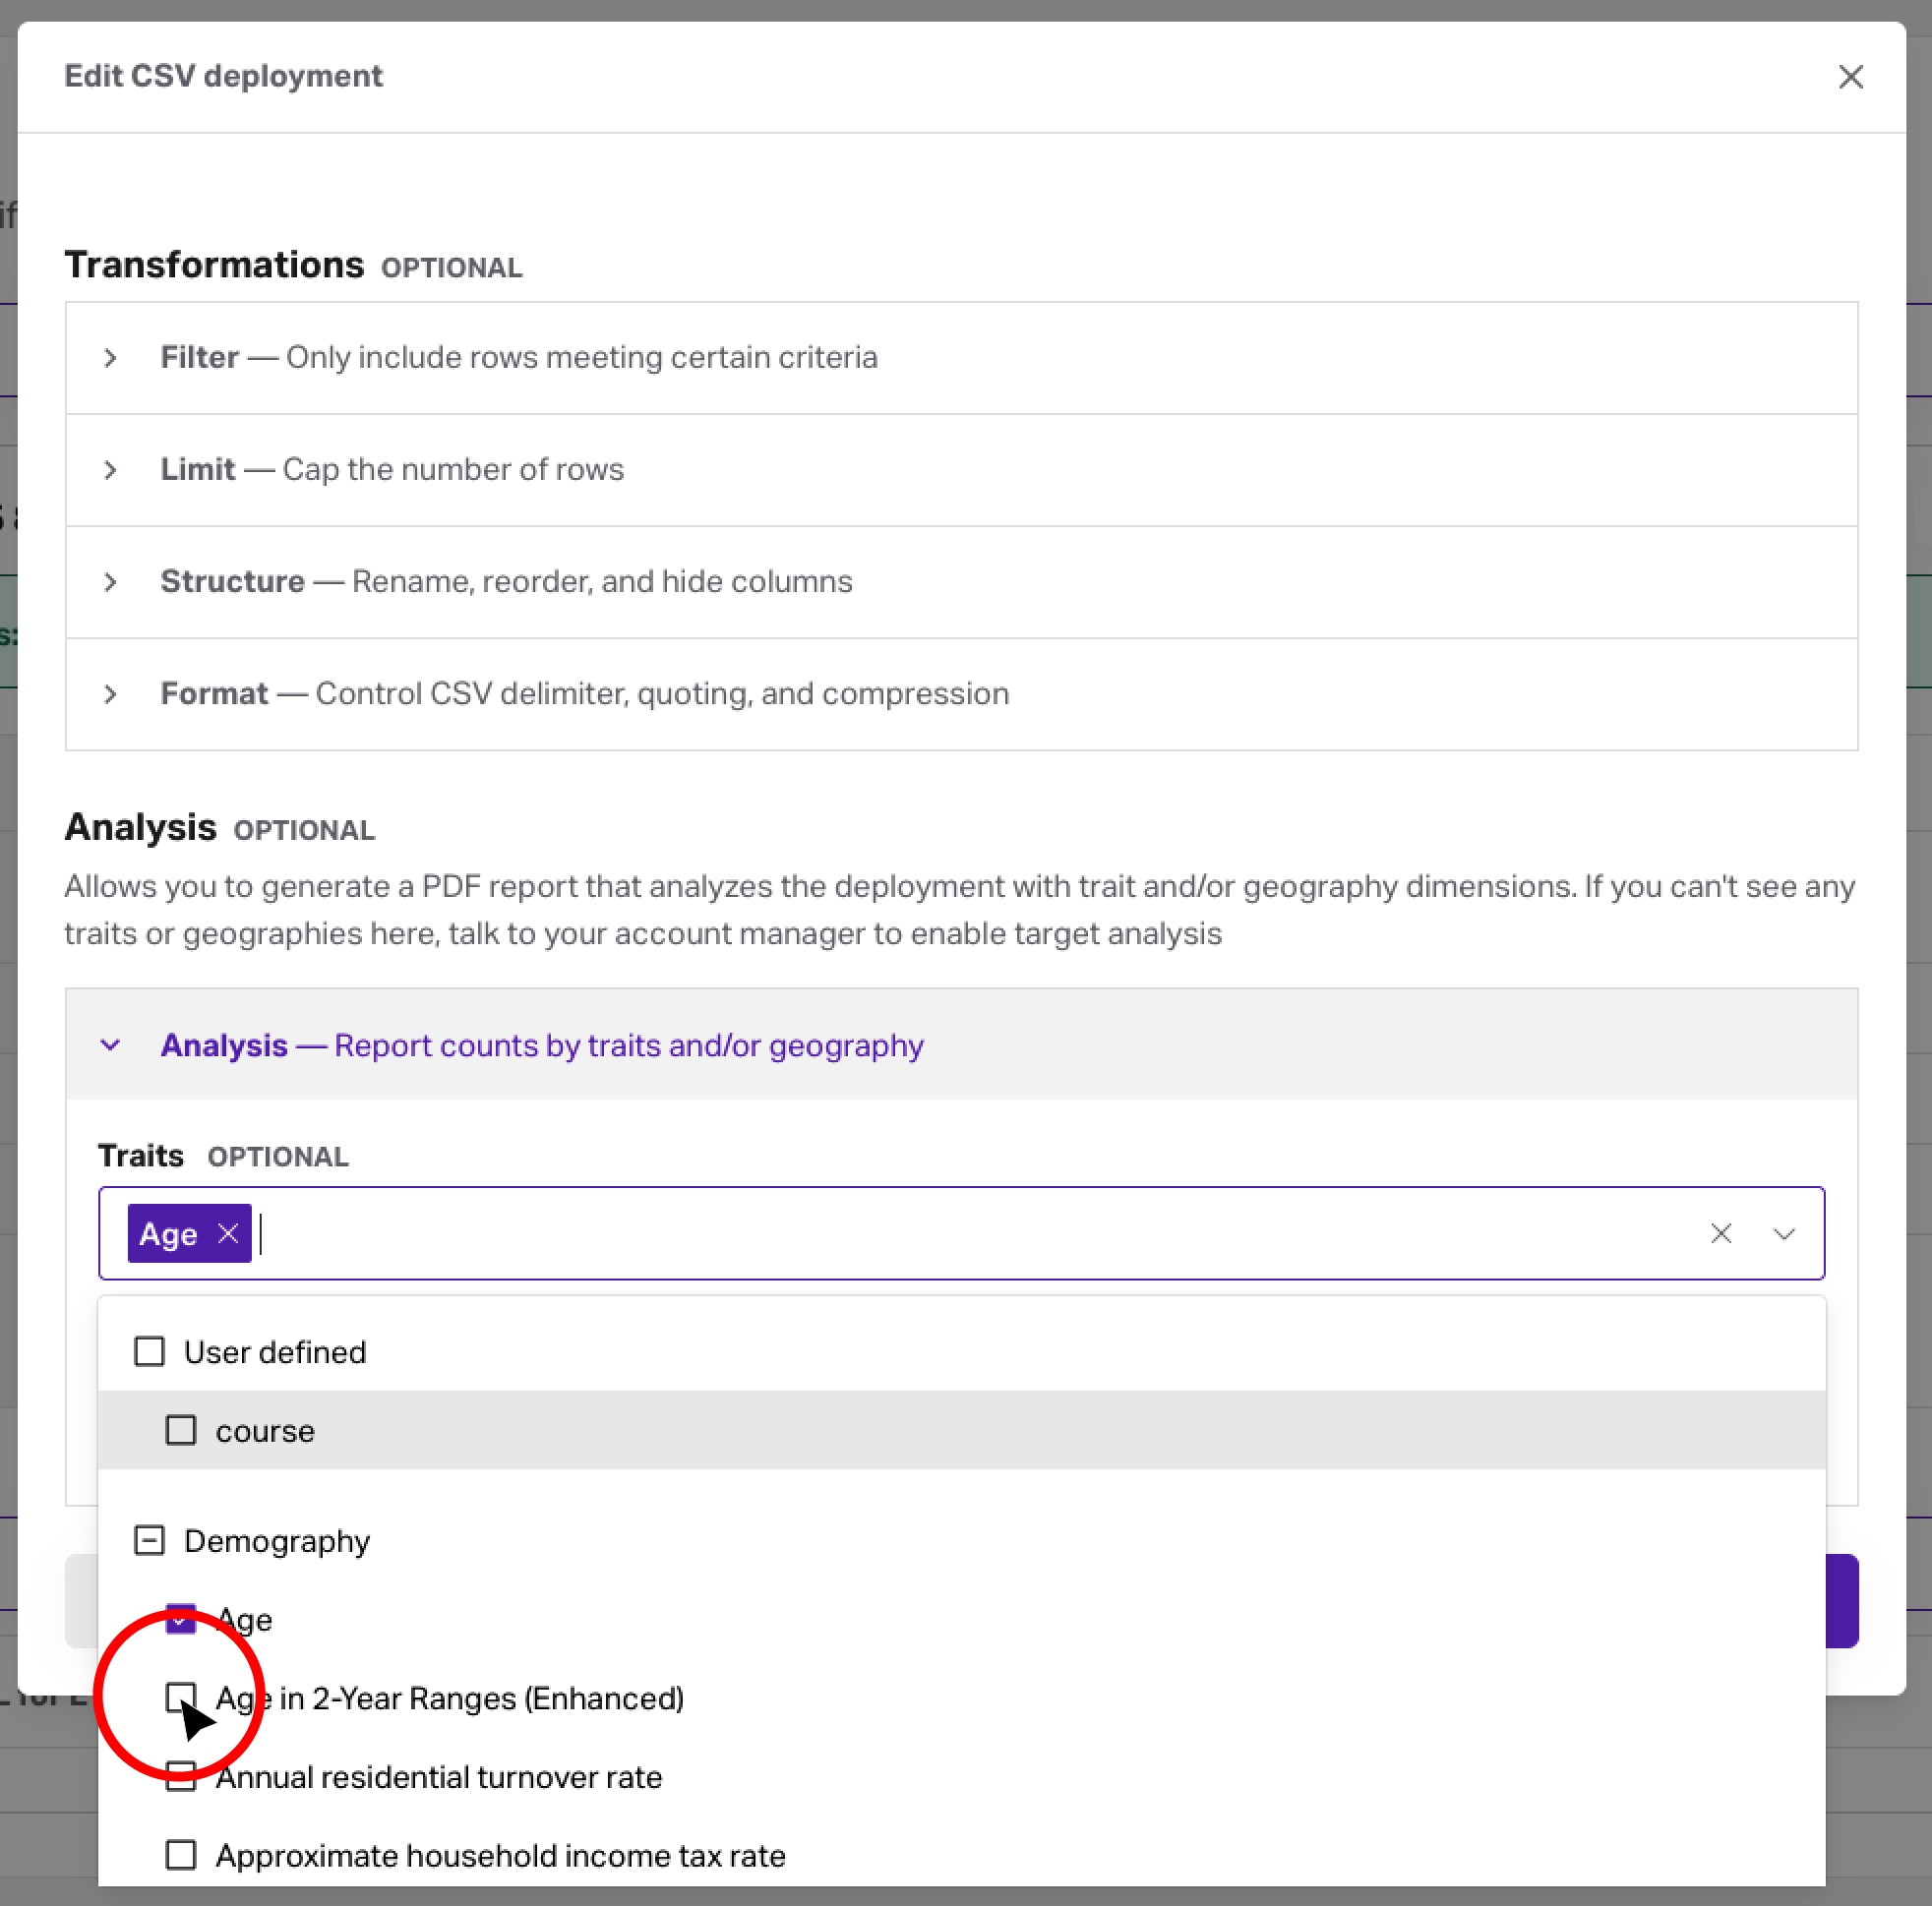
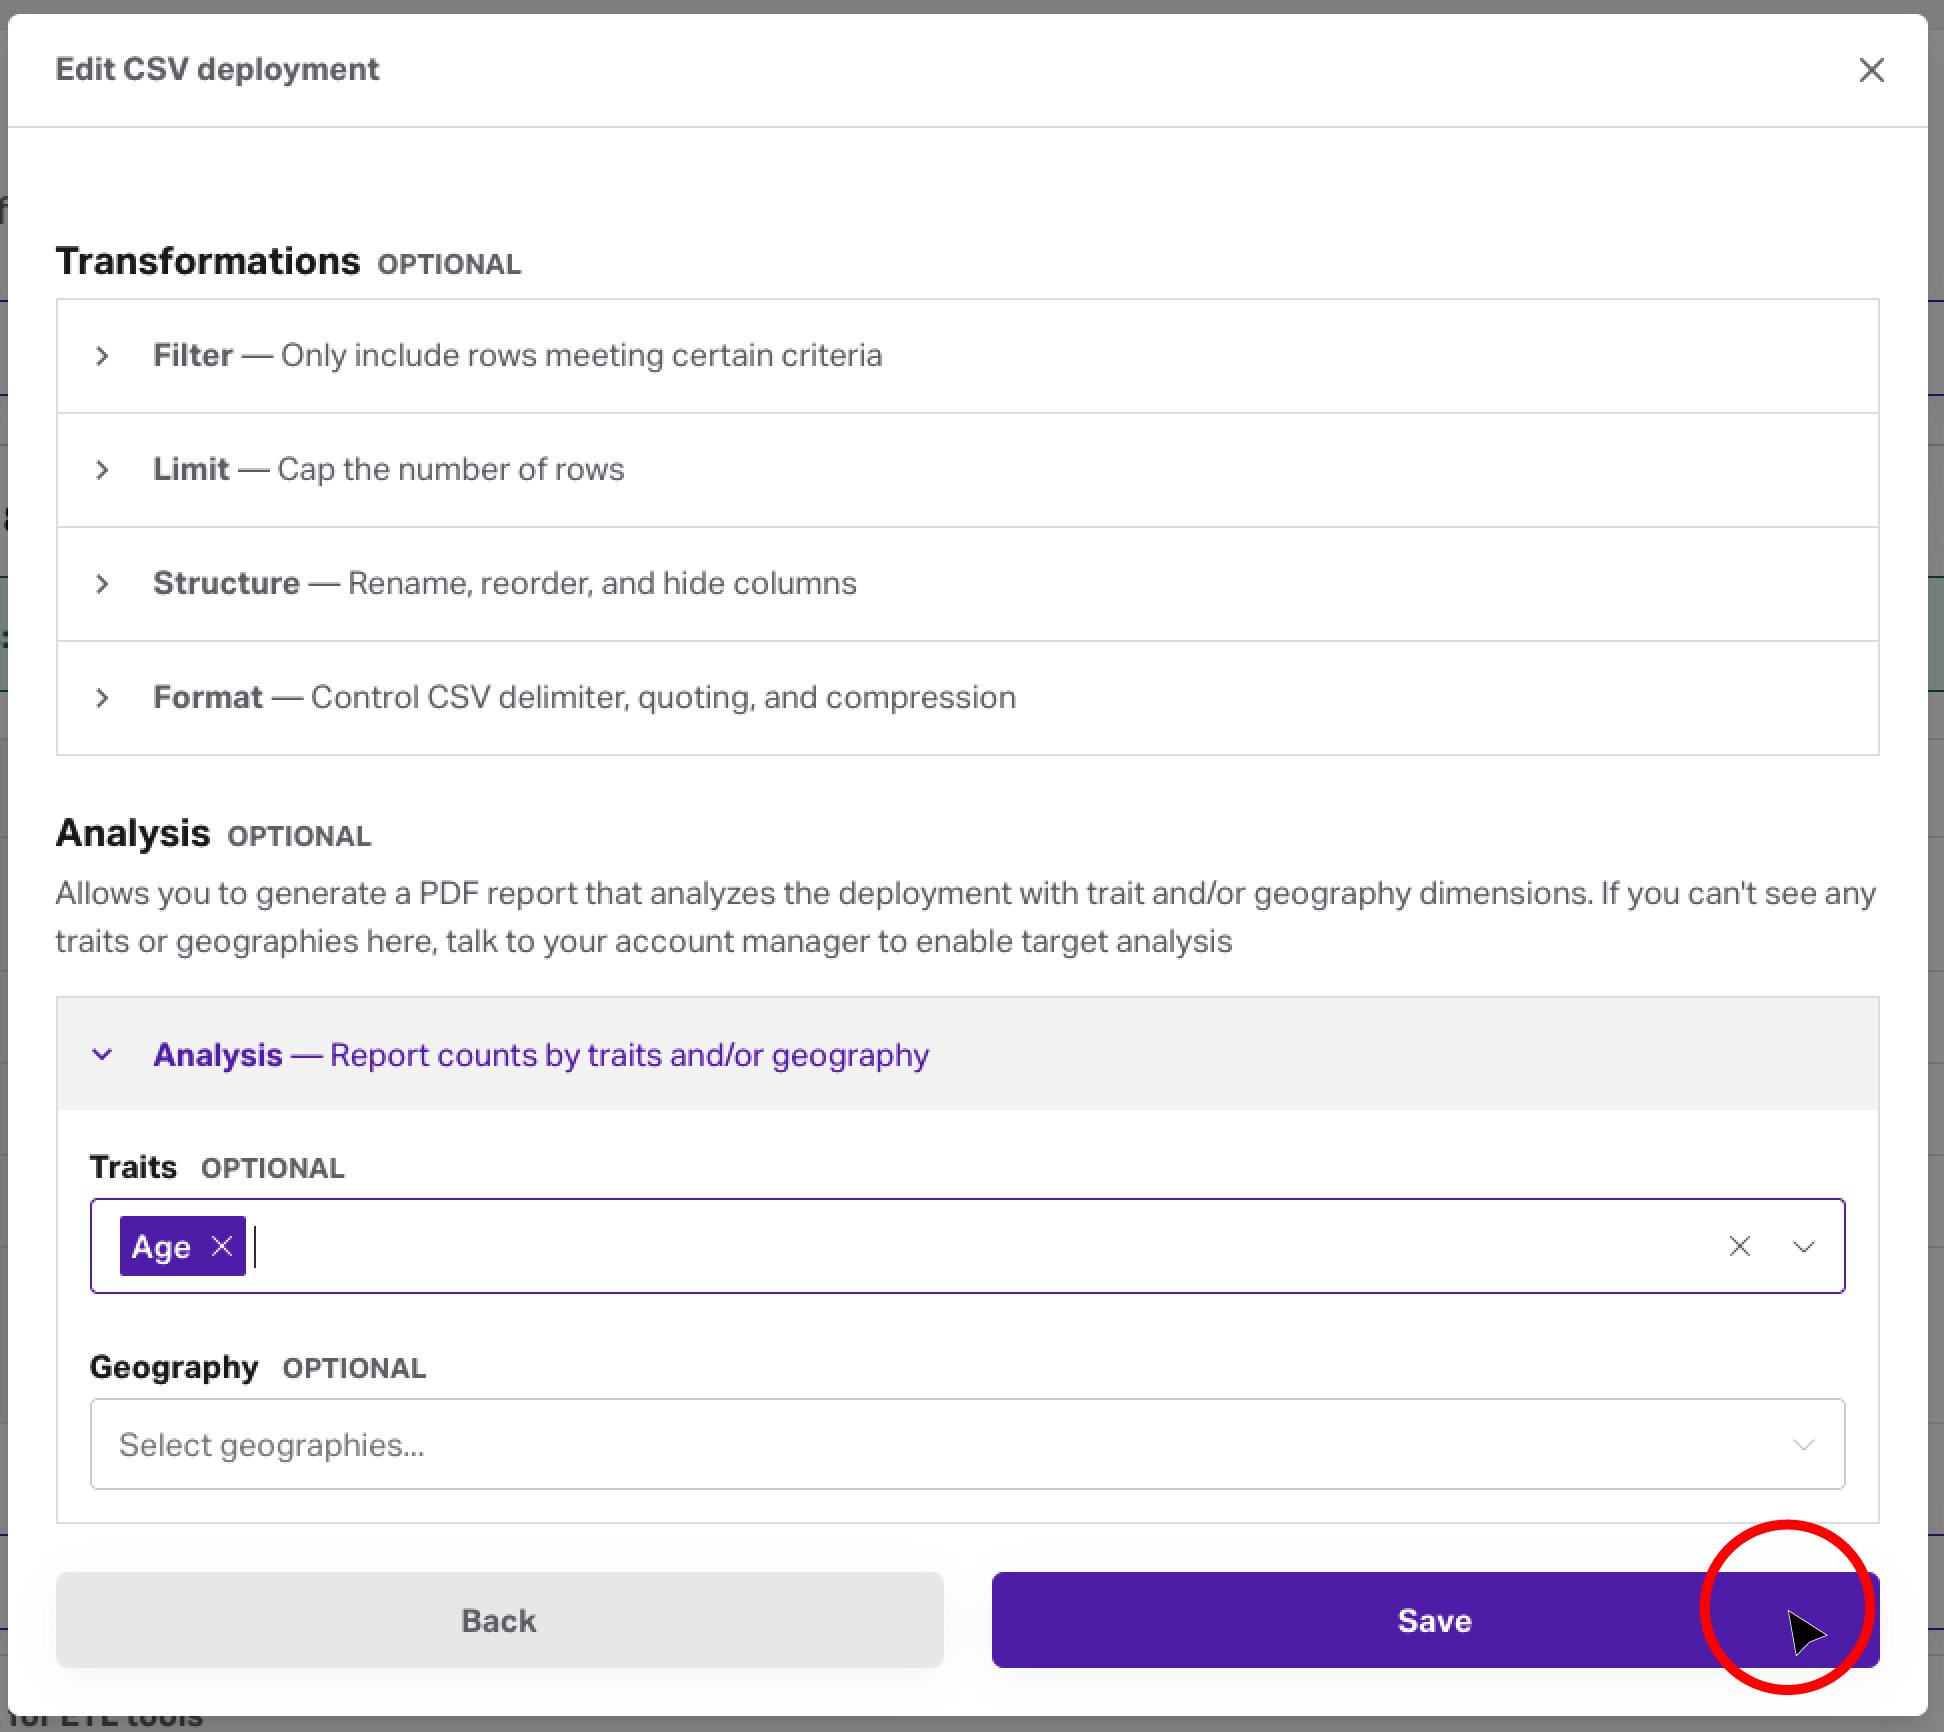
- In the Deployment section, either create a new deployment you want analyzed (with the Add deployment button), or find an existing deployment and choose Edit from its actions menu.
- Configure your deployment as usual, and when you get to the second step, use the Analysis section to request your analysis. Select traits and/or geography levels to include in the analysis.
- Save the configuration and wait for analysis to complete.
- Once complete, download the report from the deployment’s actions menu.
Using the API
To request analysis via API, use the POST or PATCH /targets endpoint, along with the analysis_config property, to specify traits and geography levels.
To learn more about how to make this request in API, visit our documentation page.
Retrieving your report
Once generated, reports can be accessed through both the Dashboard and API.
In the Dashboard
Reports appear as downloadable PDFs in the deployment actions menu.
Using the API
- Download the PDF using GET /targets/
$TARGET_ID/analysis/pdf. - Retrieve raw data in JSON format using GET /targets/
$TARGET_ID/analysis.
To learn more about how to make this request in API, visit our documentation page for retrieving PDF reports, or this page which covers retrieving the associated JSON data.