Cohorts
Cohorts are groups of people that your business is interested in, such as customers and leads.
Cohorts overview
Cohorts are groups of people that are interesting to your business–they're the building blocks of your customer predictions. You'll start working with cohorts by creating the most important one–your current customers.
You'll define your customers cohort by choosing which event best describes how you define your customers–maybe it's those individuals that have made a transaction, or who've signed up for one of your services. Regardless of how your business defines its customers, your customers cohort will be the basis of your predictions in Faraday.
When using outcomes to create propensity predictions, for example, you'll point your other cohorts–your leads, prospects, and other interesting groups–toward your customers cohort and ask Faraday to find which individuals in those groups are most likely become customers. Similarly, with persona predictions, you'll choose the cohort that you want to predict personas for.
With your foundational cohort in your customers defined, you'll then create others that best fit the use cases that you're interested in powering with predictions. You'll accomplish this using both your first-party data, and third-party data from the Faraday Identity Graph to create specific events and traits that define each group. Each cohort you create can include events, traits, or a mix of both.
For cohort creation instructions using both the Dashboard UI and API, see our how-to docs for cohorts.
👍Key takeaway: cohorts
Cohorts are groups of people that are interesting to your business. They're defined by events and traits, and can be built through both your first-party data as well as Faraday's third-party data. In Faraday, you'll create cohorts for your customers, leads, prospects, and more, to power your predictions.
Event-based cohorts
The majority of your cohorts in Faraday will be defined, at least in part, by an event. This event might take the form of a transaction, a form signup, a cancellation, or some other important occurrence. Beyond your customers, you might create more nuanced versions of your customers, like "repeat purchasers" or "churned customers."
As you add an event to a cohort, you're able to specify recency, frequency, earned value, and other properties to allow you to add these more nuanced restrictions to cohorts to empower other predictions.
- Recency: allows you to set days-ago ranges on the event. An example of this would be if you're interested in creating a cohort based on customers who've placed orders between 30 and 90 days ago.
- Frequency: allows you to set a range on the number of occurrences of the event. An example of this would be if you're interested in creating a cohort based on customers that have made more than 3 orders.
- Value: allows you to set a range on the value of the event–generally orders. An example of this would be if you're interested in creating a cohort based on customers who've spent over $100.
📘Event properties
Optionally, properties can be added to an event. For example, a “gift buyers” cohort could exclusively include people who experience “transaction” events with the “gift” property set to true. You can add these properties to events in a dataset as long as they exist in your data.
Trait-based cohorts
Using both your data and Faraday's, traits can be added to cohorts to create further nuances. This can be useful to in several scenarios:
- Geographies: if you're looking to expand with a new physical storefront, you might score cohorts of leads in specific geographies to find the highest-impact location.
- Subgroups: if you're a business that focuses on a specific subgroup of people, is launching a new product focused on a specific subgroup, or something similar, you might create a cohort of people based on that subgroup–like "all women leads" for a womens' swimwear brand.
- Direct mailers: if you want to launch a direct mail campaign, you can create a cohort using geographic targeting in addition to mailer-specific traits, such as "record quality code" to ensure they can receive mail.
📘Excluding values and missing values
When selecting either Exclude exact values from list or Does not equal one of, missing values will be included in the selection. In order to exclude particular values and exclude missing values instead use Select exact values from list or Equals one of respectively.
📘True/false traits
When selecting true/false traits, like dog ownership, you're given the option to check true, false, and missing. In these scenarios, true means that they currently own a dog, false means they don't, and missing means they haven't reported as owning a dog via the data in the Faraday Identity Graph. In some cases, it may be worth including missing in a cohort's trait since there's a chance that they do fall into the selected trait, but haven't reported it.
📘Age trait range
When selecting age as a trait, always select one year beyond the year you're targeting as it is inclusive. Looking to target customers 20-30 years of age? Select 20-31 year olds on the slider.
Advanced cohort building with events
In cohorts, the order in which filters are applied is fixed. This means that while the order matters, the order stays the same, and this results in non-ambiguous cohort building.
The order in which we apply filters to an event stream is as follows:
- Non-event based filters: Traits and places
- Time-based event stream properties: Recency and frequency
- Event stream properties: Value, product, and any additional user defined properties
This makes the most difference when looking at event stream properties. In the case where we have an event stream property such as "product_name," and our events are a series of orders, this will change over time.
If we define a cohort to have a frequency of >= 2 orders and "product_name" = "product A", we'll find all individuals who have at least 2 orders, at least one of which is product A. This happens because we first find all individuals with two orders or more, and then find all instances of product A within those individual orders. If an individual has at least 1 order containing product A, they'll be included.
If we instead want to find all individuals with 2+ orders of product A, we need to use events to create an event with a condition that all orders within that event are product A, and build our cohort on that.
Doing this will effectively shift the order of our filtering from the above, to the following:
- Event stream properties
- Non-event based filters
- Time-based event stream properties
With this new order, we first filter out all orders which contain product A, and then find all individuals which have 2 or more orders in the event stream containing only product A.
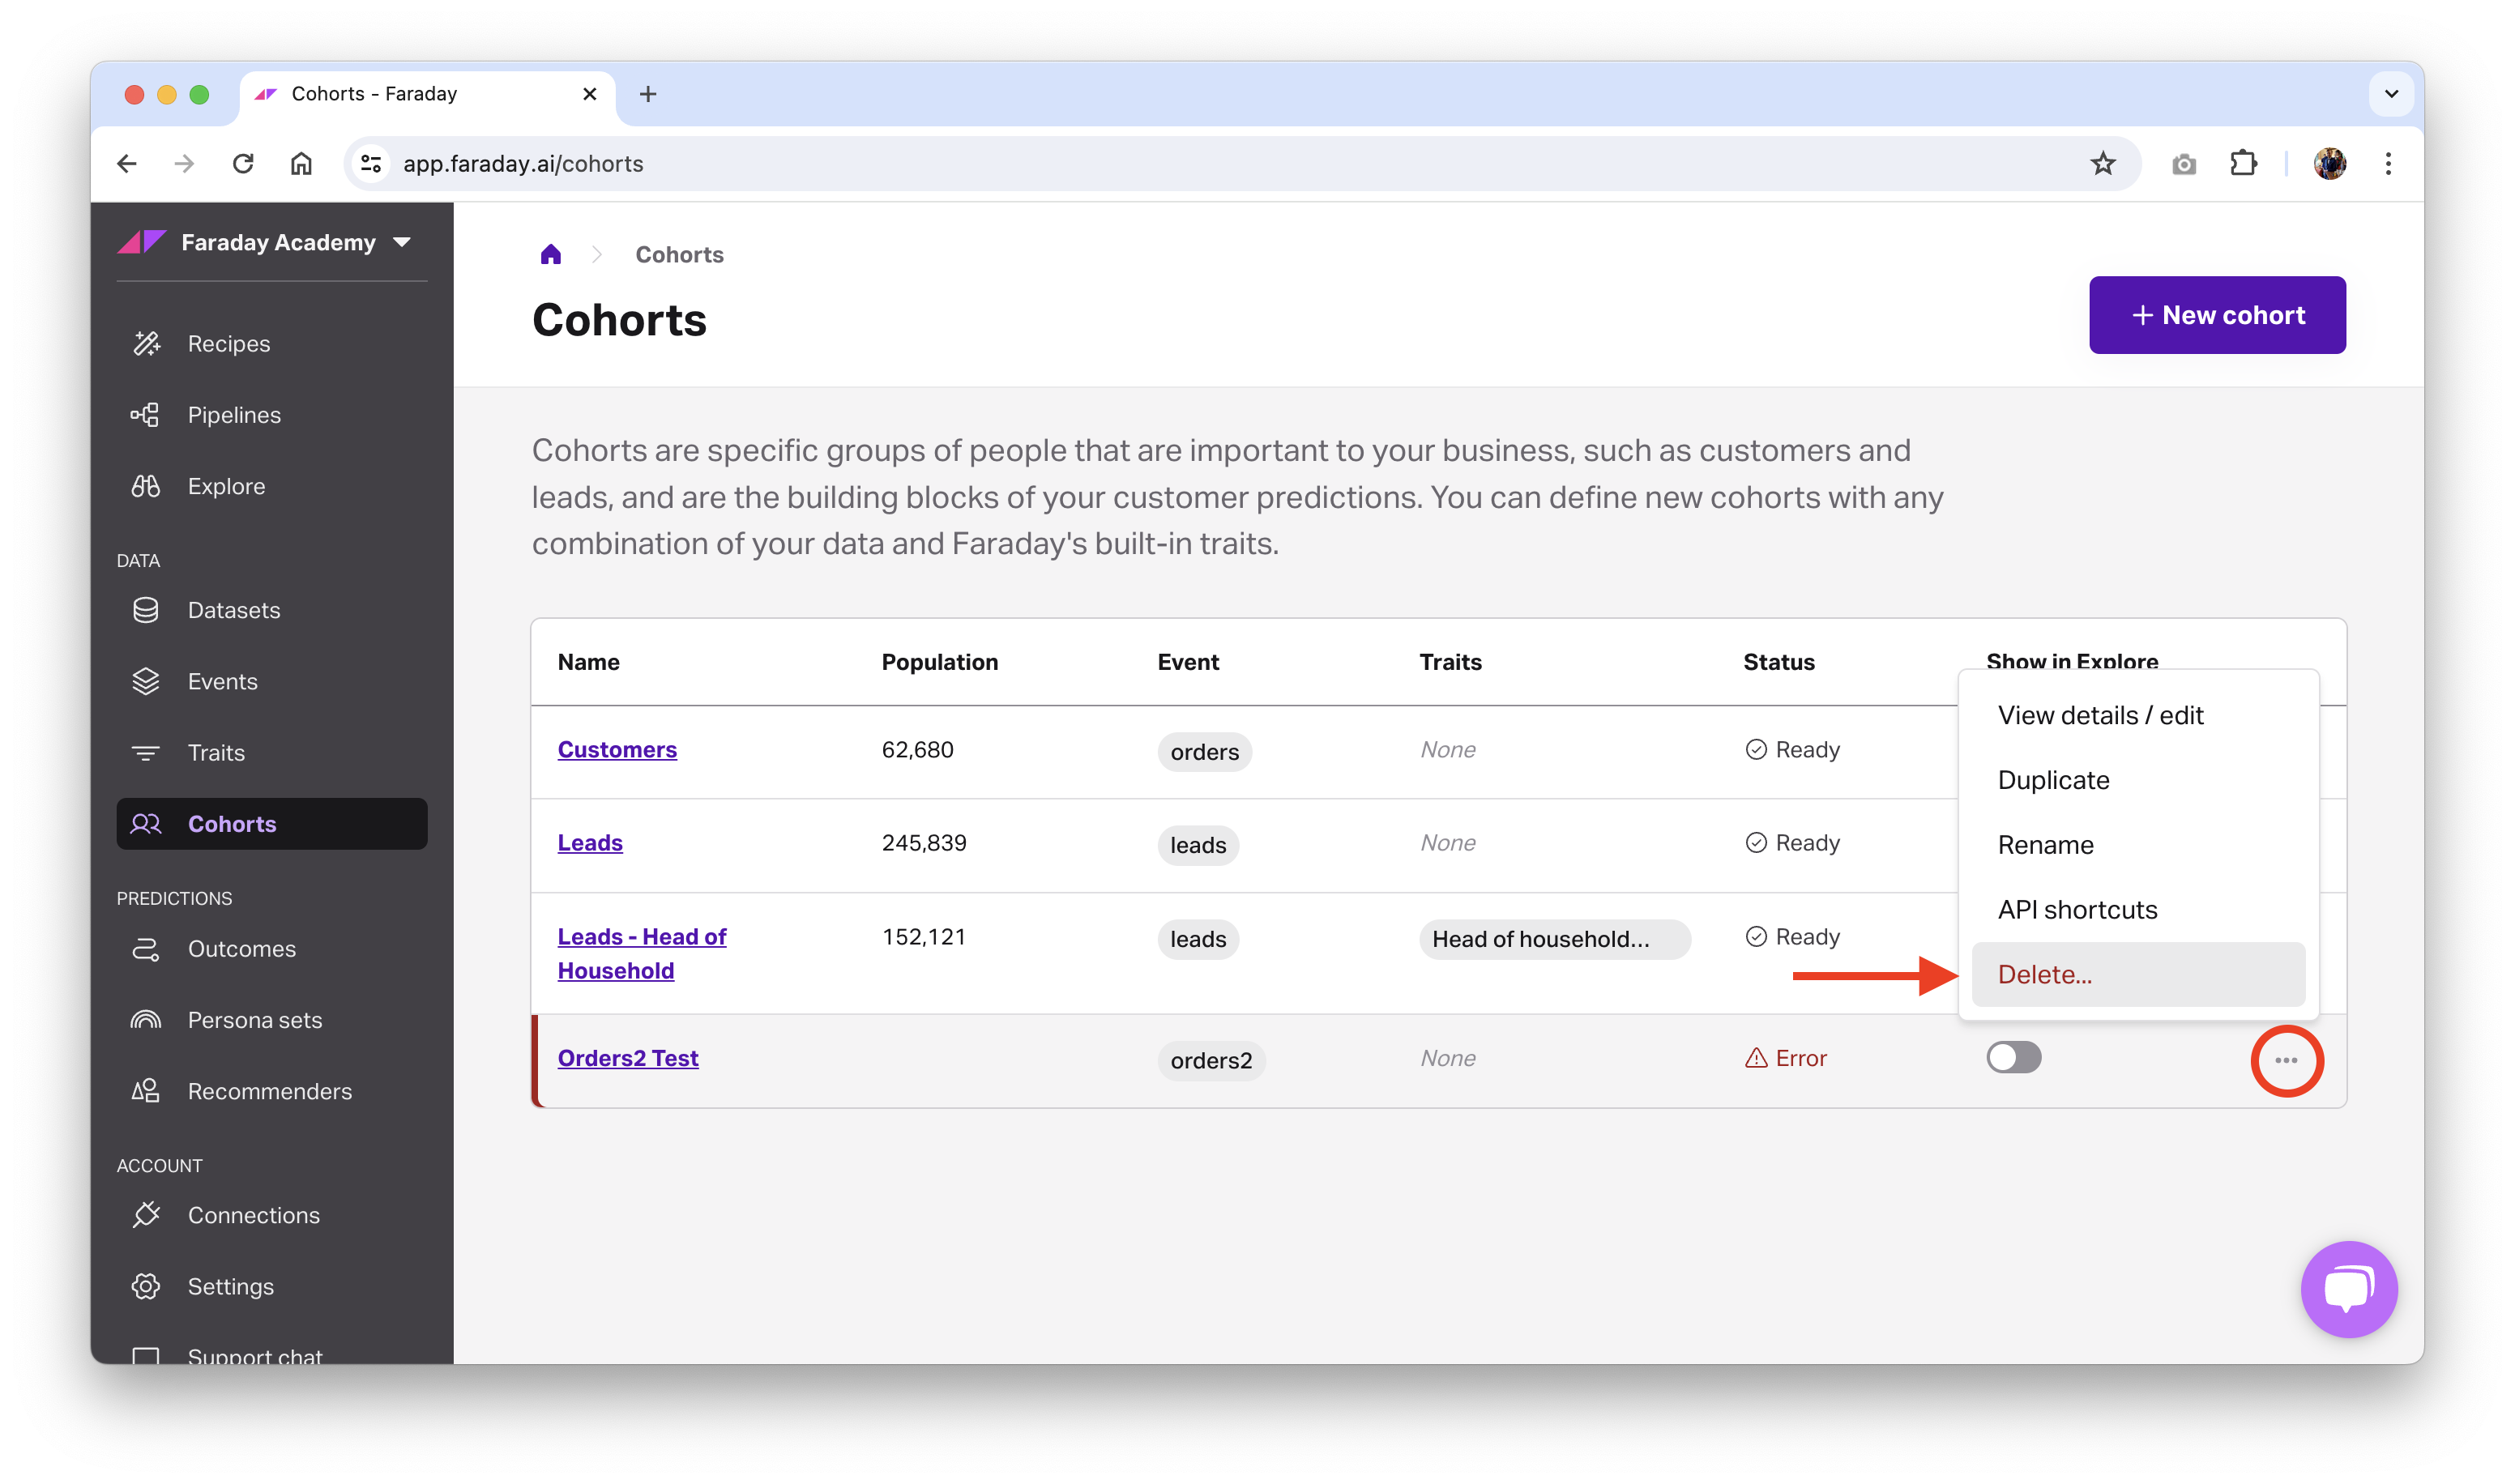
Deleting or archiving a cohort
Before deleting a cohort, ensure that resources using it, such as a pipeline or an outcome, are no longer using it. Once there are no other resources using the cohort, you can safely delete it.
- Dashboard: click the ... menu on the far right of the cohort you'd like to delete or archive (or upper right while viewing a specific one), then click the relevant option.
- API: use the delete cohort or archive cohort API requests.
📘Deleting and archiving resources
See object preservation for more info on deleting and archiving resources.