Datasets
Datasets are how you describe your data to Faraday, accomplished through identity sets, events, and traits.
Datasets overview
Datasets are how you describe your data to Faraday. When creating a dataset–accomplished thanks to a connection or a CSV upload–you'll organize your dataset into identity sets, events, and traits.
- Identity sets: identity sets are used to help Faraday identify people in your data, using identifiers like email, name, and address. An identity set is almost always required.
📘Key properties to map
Not all property fields in an identity set are required, but email and address are the most useful for identifying people. The more fields you include, the more likely to match the people are.
- Events: events show Faraday how to recognize actions taking place in your data, such as purchases, renewals, click events, upsells, etc. Dates are often the most useful piece of data for events. Events can include event properties, which are data points about the event itself, such as product category.
- Traits: traits are interesting data points that can enhance the usefulness of your data in Faraday, but aren't used to identify a person or an event (e.g. whether a person rents or owns their home, income, hobbies, etc).
🚧️Deleting events and traits from a dataset
Deleting an event or trait from a dataset without first deleting any cohort that is defined by the event or trait may cause the cohort to error, and result in a removal of the population in the cohort. Ensure that you delete any resources that are using the event or trait–or change the cohort definition–before you delete it.
A completed dataset's identity sets, events, and traits will help power everything you do in Faraday. Identity sets are used for identity resolution, events for building recommender predictions, and both events and traits for building cohorts. From there, your cohorts fuel the predictions you create in outcomes and persona sets.
For dataset creation instructions using both the Dashboard UI and API, see our how-to docs for event streams.
👍Key takeaway: datasets
Datasets are how you describe your data to Faraday. They're created through identity sets for identity resolution, events to mark key actions in your data, and traits to note interesting data points about individuals. Once built, what you define within a dataset will power everything you do in Faraday.
How do we match?
When you upload data to Faraday—whether via a connection or CSV upload—we match each record against the Faraday Identity Graph (FIG) to recognize known individuals and households in the U.S. population. This process is called identity resolution.
Identifier priority
Faraday uses a deterministic matching hierarchy to ensure the most accurate identity resolution possible. When multiple identifiers are present, we prioritize matches in this order:
- Full name + full street address
- Full name + email address
- Last name + email address
- Full name + phone number
- Email address only
- Full name + ZIP/postal code
- Full name + state
- Full name only
Each step down this list represents a less specific—or less reliable—linkage between your data and the Faraday Identity Graph. The more complete your identity information (especially name + address or email), the higher your match confidence and overall enrichment rate.
If a unique individual can’t be confirmed, Faraday may still match at the household level to enable property-based enrichment.
Match rate and data enrichment
How match rate is calculated
Your data passes through three stages:
- Rows — the total number of rows in your uploaded data.
- Identified people — the distinct individuals resolved from those rows. This can be lower than your row count because multiple rows may describe the same person (e.g. repeat purchases) or because some rows lack enough identifying information.
- Matched people — the subset of identified people for whom Faraday has enrichment data available, either at the individual level or the household/address level. This data comes from the Faraday Identity Graph (FIG) and, when enabled, Match Boost.
Match rate = matched people / identified people. The denominator is identified people, not rows — see the examples below for why this distinction matters.
Enrichment breakdown
Clicking the match rate in the datasets list shows a popover with:
- Total — the overall match rate (matched / identified).
- Faraday identity graph — people matched via FIG alone.
- Faraday match boost — additional people matched through supplemental identity providers, shown as an additive percentage (e.g. "+14%"). Match Boost increases the portion of your data that Faraday can match and enrich when your records are sparse or incomplete.
The dataset detail page adds two more metrics: enriched residences (matched at the household/address level) and enriched people (matched at the individual level). Both combine FIG and Match Boost totals.
Examples
These examples illustrate how the same match rate formula can produce different-looking results depending on your data:
| Scenario | Rows | Identified people | Matched | Enriched residences | Enriched people | Match boost |
|---|---|---|---|---|---|---|
| Clean CRM export | 10,000 | 10,000 | 9,000 (90%) | 8,500 (85%) | 8,000 (80%) | 500 (5%) |
| Transactional data | 10,000 | 5,000 | 4,000 (80%) | 3,500 (70%) | 3,000 (60%) | 500 (10%) |
| Sparse identity data | 10,000 | 5,000 | 3,000 (60%) | 2,500 (50%) | 2,000 (40%) | 1,000 (20%) |
- Clean CRM export: one row per person, so rows = identified people. Complete identity data (name + email + address on every row) produces the highest match rate because Faraday can confidently link each person to enrichment sources.
- Transactional data: 10k order rows from repeat buyers dedup to 5k identified people. Dividing matched by rows (4,000 / 10,000 = 40%) would be misleading — the denominator is always identified people. The match rate itself (80%) is solid because order data typically includes name and email.
- Sparse identity data: notice this scenario also has 5k identified people, same as transactional — but for a different reason: many rows lack enough info to resolve to an individual. And even the people who are identified tend to have weaker identity signals (e.g. name + state instead of name + address), leading to a lower match rate. See the identifier priority list above.
Metrics in the UI vs the API
The dashboard shows a summary of your dataset's metrics, while the API returns a more granular breakdown. The table below shows how they relate, using a real dataset as an example:
| Metric | Description | Example | In UI | API field |
|---|---|---|---|---|
| Rows | Total rows in your uploaded data | 10,000 | ✓ | row_count |
| Identified people | Distinct individuals resolved from your rows | 10,000 | ✓ | identified_count |
| Matched (deprecated) | Identified people Faraday found in its data. Equals fig.any + match_boost.any | 8,000 (80%) | ✓ | matched_count |
| Enriched residences | People enrichable at the household/address level (FIG + Match Boost combined) | 7,000 (70%) | ✓ | enrichment.fig.residence + enrichment.match_boost.residence |
| Enriched people | People enrichable at the individual level (FIG + Match Boost combined) | 6,000 (60%) | ✓ | enrichment.fig.person + enrichment.match_boost.person |
| Match boost | Additional people matched through supplemental identity providers | 1,000 (10%) | ✓ | enrichment.match_boost.any |
| FIG residence enrichment | People enrichable at the household level via FIG alone | 6,000 | enrichment.fig.residence | |
| FIG person enrichment | People enrichable at the individual level via FIG alone | 5,000 | enrichment.fig.person | |
| FIG any enrichment | All people matched via FIG (residence or individual) | 7,000 | ✓ | enrichment.fig.any |
| Match boost residence | People enrichable at the household level via Match Boost | 1,000 | enrichment.match_boost.residence | |
| Match boost person | People enrichable at the individual level via Match Boost | 1,000 | enrichment.match_boost.person |
All percentages are computed against identified_count.
📘matched_count is deprecated
The matched_count API field is deprecated in favor of the enrichment object. It is redundant: matched_count always equals enrichment.fig.any + enrichment.match_boost.any. The enrichment object provides the same total with a breakdown by source (FIG vs Match Boost) and precision (person vs residence), so prefer it when integrating with the API.
Improving your match rate
The most effective way to increase your match rate is to provide more complete identity data, particularly name + street address or email. See the identifier priority list above for the full hierarchy. The more identifiers you include per row, the more likely Faraday is to find a confident match.
Refreshing data in a dataset
Sometimes it might be beneficial for you to add additional data to a dataset. For example, if your original dataset was a manual upload of order data from the previous month, and you'd like to append this month's order data.
📘Automatic data sync
If you've configured a dataset via connection to your data warehouse, it will automatically be kept up to date. As such, this section is focused on manual, CSV uploads.
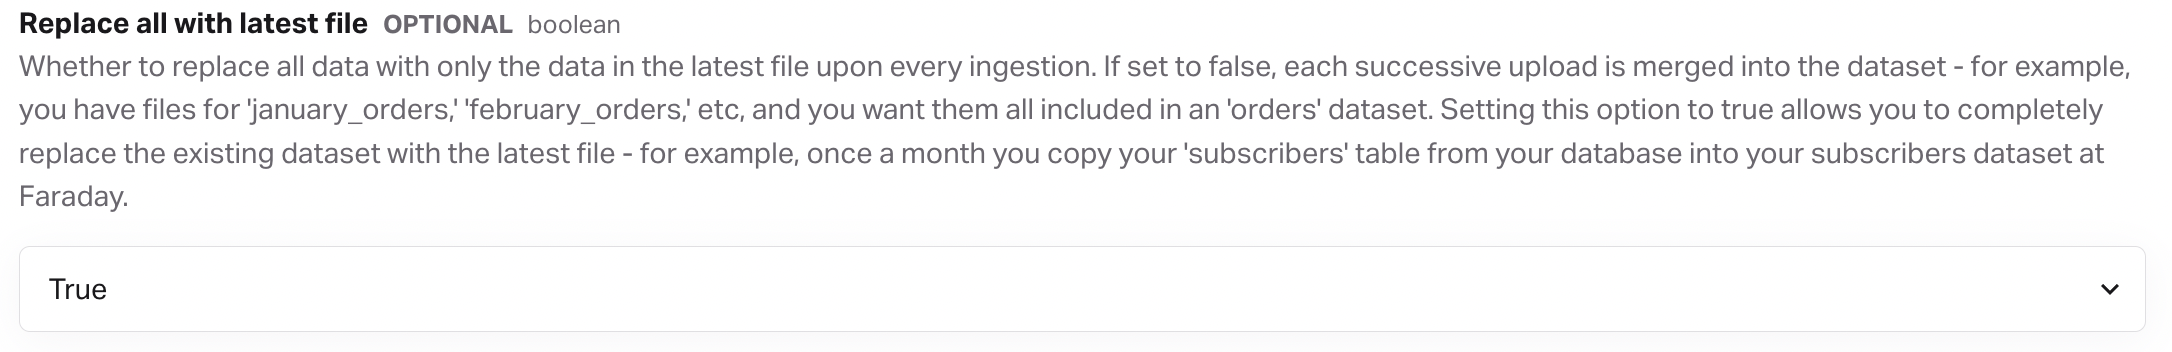
- To start, you'll want to head to the dataset you'd like to configure, expand the advanced tab, and find replace all with latest file. By default, this setting is set to false, so each time you upload data via the below steps, the new file is merged into the dataset. If the value is changed to true, the entire dataset is replaced with a new file upload.
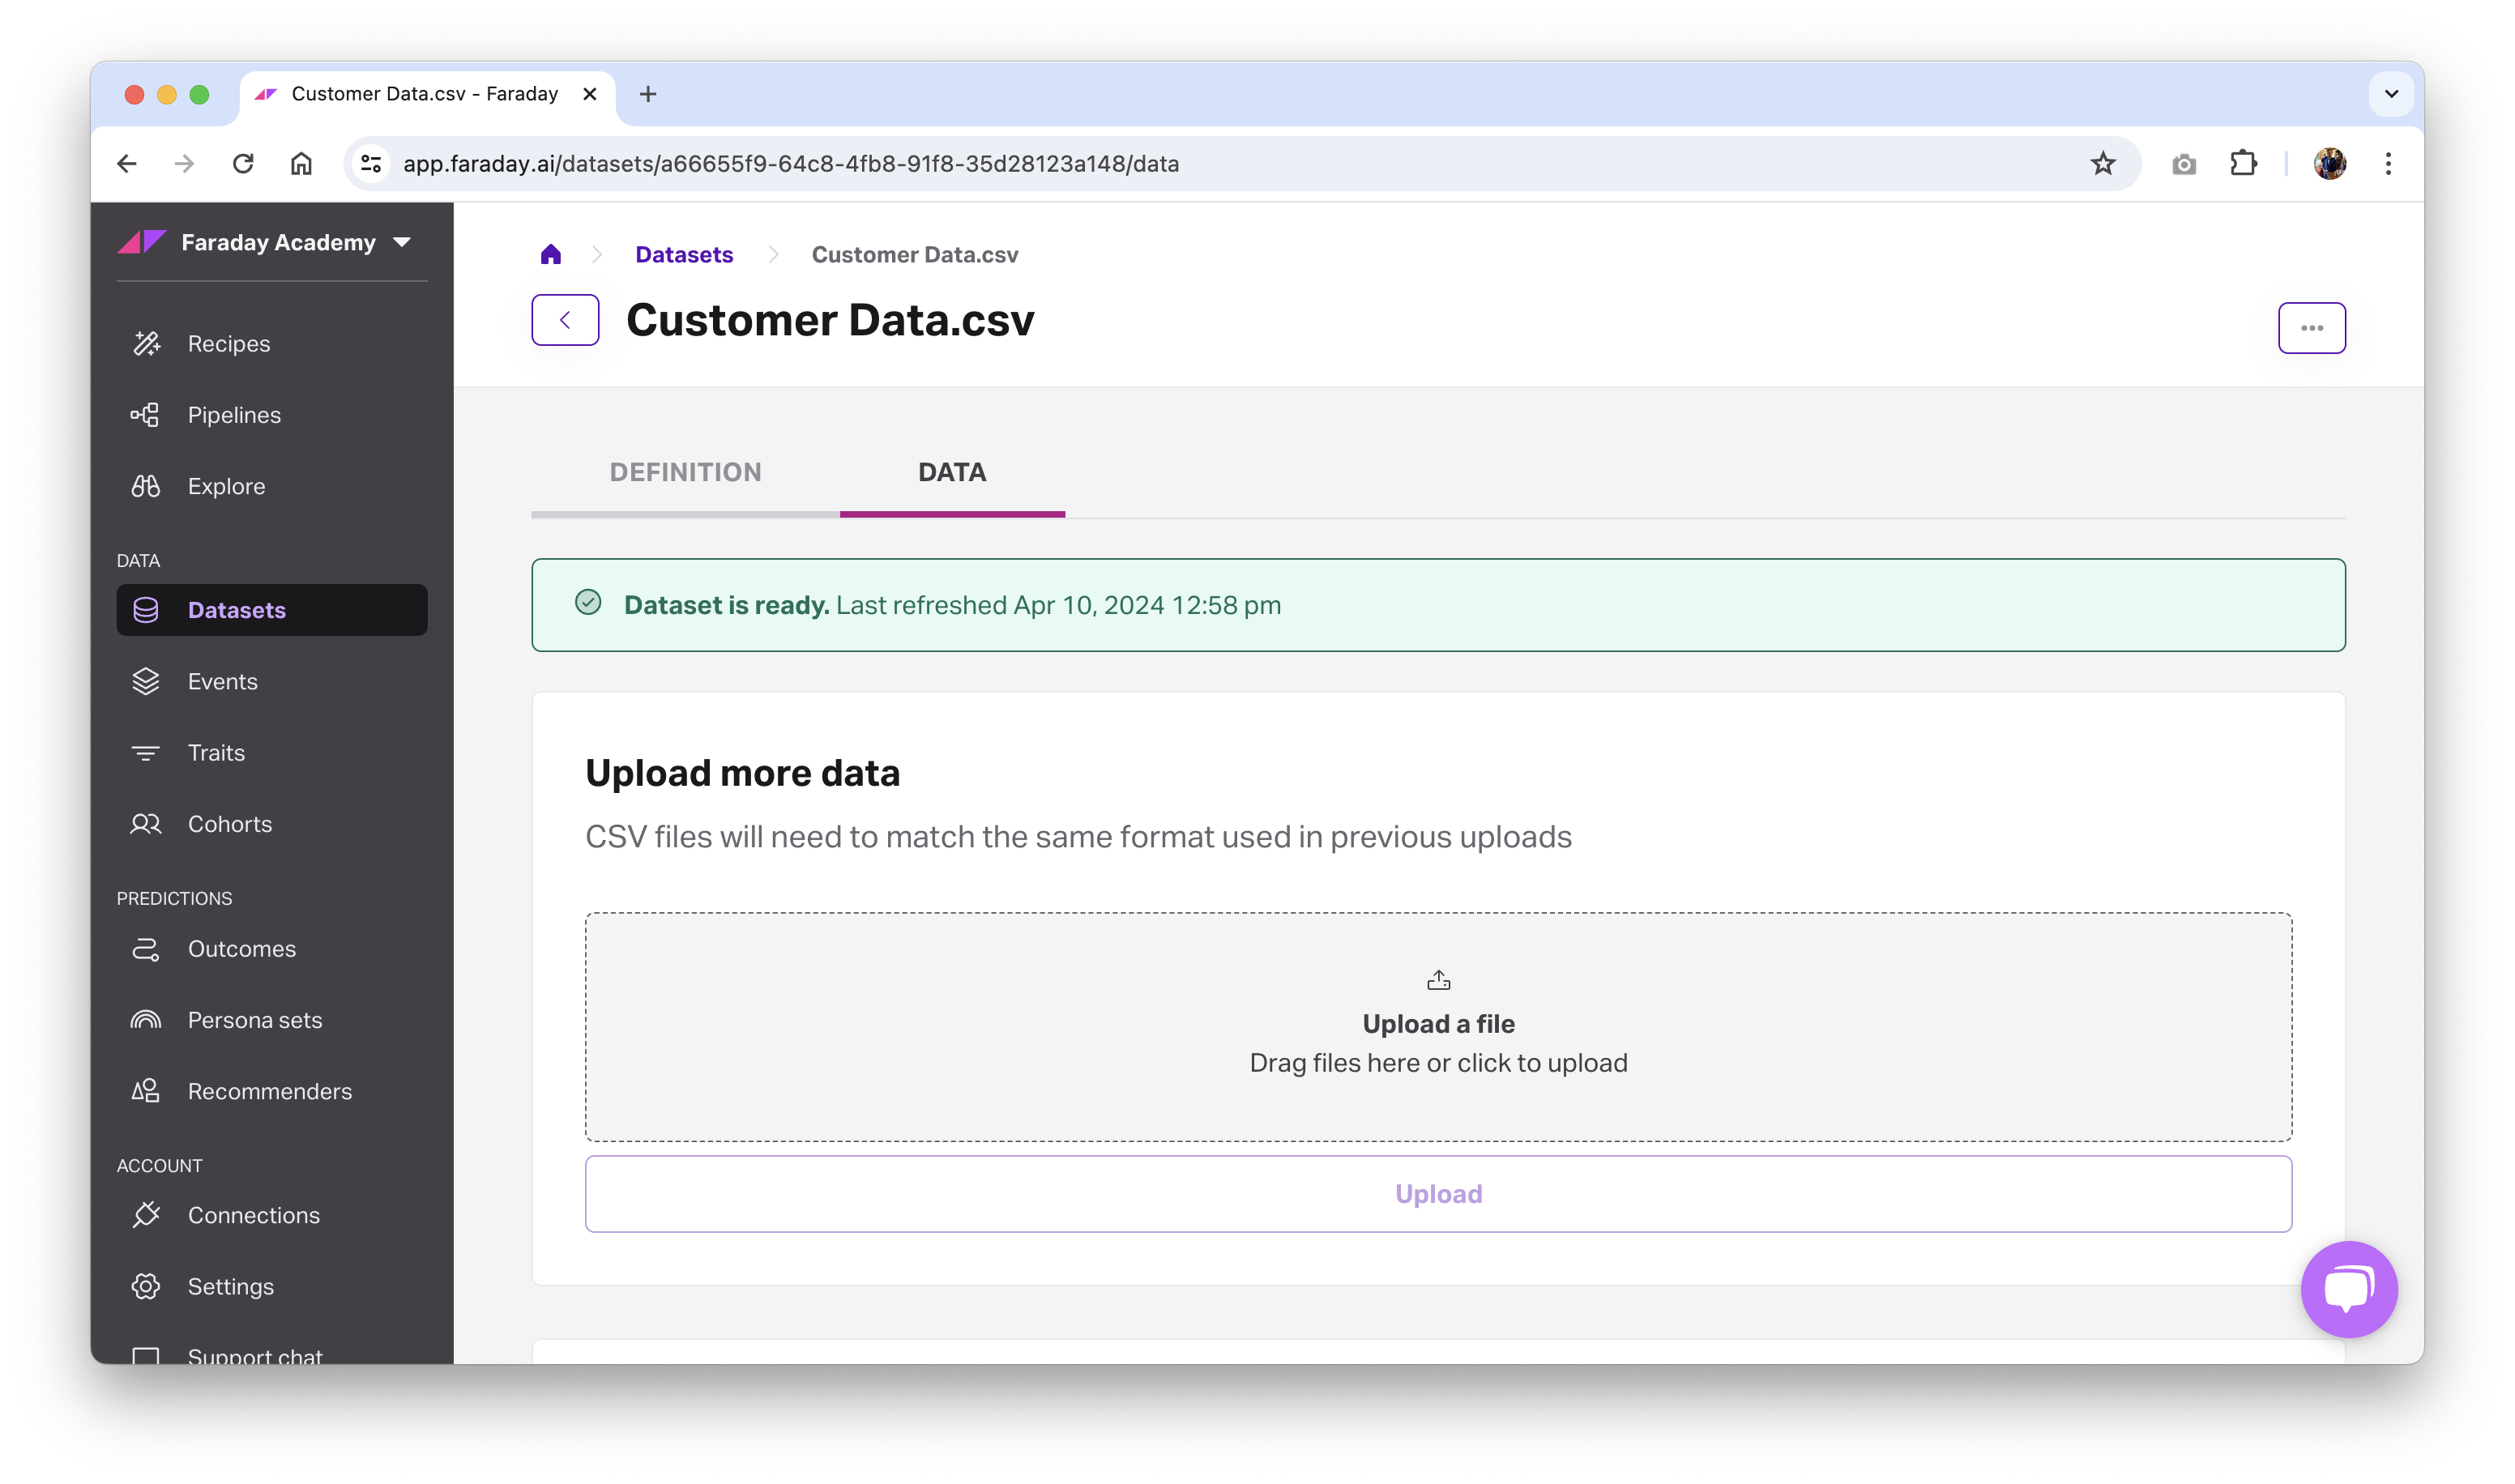
- Once in the data tab of your dataset, drag your new file to the upload prompt or click to open the file picker. When your additional file's upload is complete, it will appear in the files in dataset list and the dataset status banner at the top of the dataset (green for ready, red for error) will display the upload's refresh date.
🚧️File formats
Your additional file upload must be in the same format as the data uploaded previously in this dataset. Columns in the new CSV must exactly match those in the original CSV.
- With your new data uploaded, you can now dig back into your predictive building blocks–your cohorts, outcomes, personas, and more–and make any required edits. For example, your newest upload may have included second purchases from a customers who were in your first upload, so you can now jump into cohorts to create or update a repeat purchaser cohort.
Standard fields to send to Faraday
Faraday matches your customers into our database at the individual level, so the more info about each individual in your data, the more likely you are to have a good match rate. Date fields are extremely important when building predictive models. As an example, we like to know if someone is a customer, but more importantly, we need to know when they become a customer, or when they purchased a certain product, or took some other specific action. Often, many of the key date fields in your data might live in the orders table in your database.
| Standard field | Description |
|---|---|
| First name | Customer first name |
| Last name | Customer last name |
| Street address | Customer street address |
| City | Customer city |
| State | Customer state |
| Postcode | Customer postcode |
| Customer email address | |
| Phone | Customer phone number |
| Customer | The field in your data that determines a customer |
| Lead data | The field(s) in your data that determines a lead. Do you have various lead categories? What determines when a lead converts? Lead status? |
| Product data | Date of purchase, item purchased, price of item, product types, number of orders |
| Subscription data | Date the subscription started and/or ended |
| Customer ID | The field that will be used to match your predictions back to the appropriate customer in your stack (e.g. Salesforce ID) |
Conditional events
When adding an event in a dataset, you can use the conditions option in the Dashboard UI or using the API via the create dataset request. This option allows you to declare conditions that an event must meet in order to be considered an event.
For example, if your dataset includes a field that classifies a transaction as cancelled, you can set a condition that requires the event's cancelled field to be false, resulting in all cancelled transactions being filtered out of that event.
You can also mark conditions as optional, which enables OR logic. By default, all conditions are treated as required and combined using AND—meaning all must be true for the event to qualify. But when one or more conditions are marked optional, only one of the optional conditions needs to be true for the event to match. This gives you more flexibility in modeling event logic, allowing multiple possible paths into the same stream or outcome.
Understanding data in Faraday
Event streams
If you've already checked out our article what data Faraday expects then you're well on your way to understanding what is specifically needed for prediction modeling in Faraday's system.
However, to drive home these best practices, here are some hypothetical examples to help understand how we bridge the gap between the incoming data we take and the models that you help design to predict your desired outcomes!
Even if you seem to understand the concept of an event stream it is always nice to see visual examples that show the shape of the data as you look at it in a database or spreadsheet.
Faraday has 4 base-level data points we utilize when we're processing any particular stream of events that you give us:
- date (datetime)
- value (i.e. - monetary value of said event per your business)
- product(s)
- channel (e.g. - "acquisition source")
📘Data Faraday wants
The data you upload isn't limited only to the above - give us all data points you desire to, which are meaningful to your business outcome!
Example 1: item-level data
Example 2: customer-level data
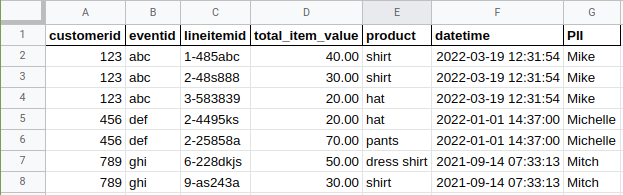
Example 3: event-level data
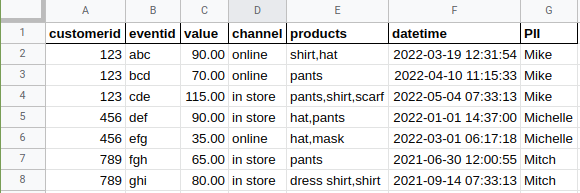
Example 3, the event-level data image, is the key to focus on. There are a couple assumptions here:
-
The event examples above are based on orders. What if your business doesn't specifically operate on orders? No problem, you may simulate this same data for any specific event stream that constitutes a individual's behavior in your system:
-
Insurance policies started
-
Emails clicked or bounced
-
Leads created
-
Investments made
-
Etc.
-
-
We also assume your product set within the file is made up of 10-20 (max) easily-readable grouped categories. These are high-indexing across the historical events you provided, so ideally they have coverage across most of the events that have happened.
- Overall, you might have 1000 different products.
- These products may need to be mapped from SKUs or pattern-matched according to some rule you have:
- "Has the word 'deluxe' in the title."
- "SKUs beginning with "AM-" are our armchairs."
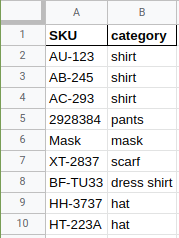
If you need to map or group your products in a more concise manner that might not be a simple pattern you can elucidate, a "SKU mapping" spreadsheet can supplement your data. We will take your mapping spreadsheet and join it direct to your data as if you provided it in the main dataset.
Example of SKU mapping
Why would Faraday be interested in all the metadata that accompanies a particular event record (i.e. - value, channel, product, etc)? Read the next section to learn more about how we use these features to roll-up data by individual.
Roll-ups
Many clients may come to the table providing data that is "rolled up" or "aggregated" already, which does not provide the event level data Faraday requests. While this type of data is holistically useful for business analysts and business leadership to understand trends, patterns and summary attributes about an individual, Faraday already has a automated system in place to do just this.
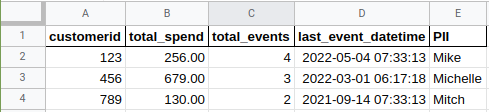
Example of rollup data:

The reason Faraday is asking for event-specific data is because our prediction modeling system is built on individuals entering certain cohorts, based on a date. Having only the first or last date of an event (as in the above screenshot) actually hinders our ability to model off of your customers.
Faraday will take in your data:
- Event-by-event, along with all other associated fields in the row.
- Match these events to known identities using our algorithm
- Make assessments on meaningful, strong-signaled patterns present.
Therefore, rollups are the way to represent the aggregation of a single field in an event stream, based on some window prior and relative to the reference date provided in its definition. These can be leveraged by cohort membership and joined directly to those individuals for enrichment to the outcome. More common examples of types of aggregations might be (but not limited to):
-
COUNT
-
SUM
-
UNION (distinct values)
-
MAX
-
MIN
-
windowed DAYS FROM
which may be translated into things like:
-
COUNT of orders from day 1 to day 90
-
SUM of policy payments received from day 30 to day 60
-
UNION of distinct browser types viewing pages last 7 days
-
MAX value of investments from 284 to 365 days
-
MIN value of payment (all time)
-
DAYS FROM first event to last event
The result of a particular rollup is a single feature for a household (specifically, an "individual") in either the training or scoring data. These stand as important first-party data characteristics that can be used to tune and/or queue your model to providing a greater level of specificity on behaviors you may not have even know existed within the data.
Known contacts (KCs)
Known Contacts (KCs) are defined as a count of distinct identities that are found within your data in a dataset, regardless of whether those identities are recognized or enriched by the Faraday Identity Graph.
Deleting or archiving a dataset
Before deleting a dataset, ensure that all resources using it, such as an event stream, any cohorts using those event streams, any outcomes using those cohorts, etc, are no longer using it. Once there are no other resources using the dataset, you can safely delete it.
- Dashboard: click the ... menu on the far right of the dataset you'd like to delete or archive (or upper right while viewing a specific one), then click the relevant option.
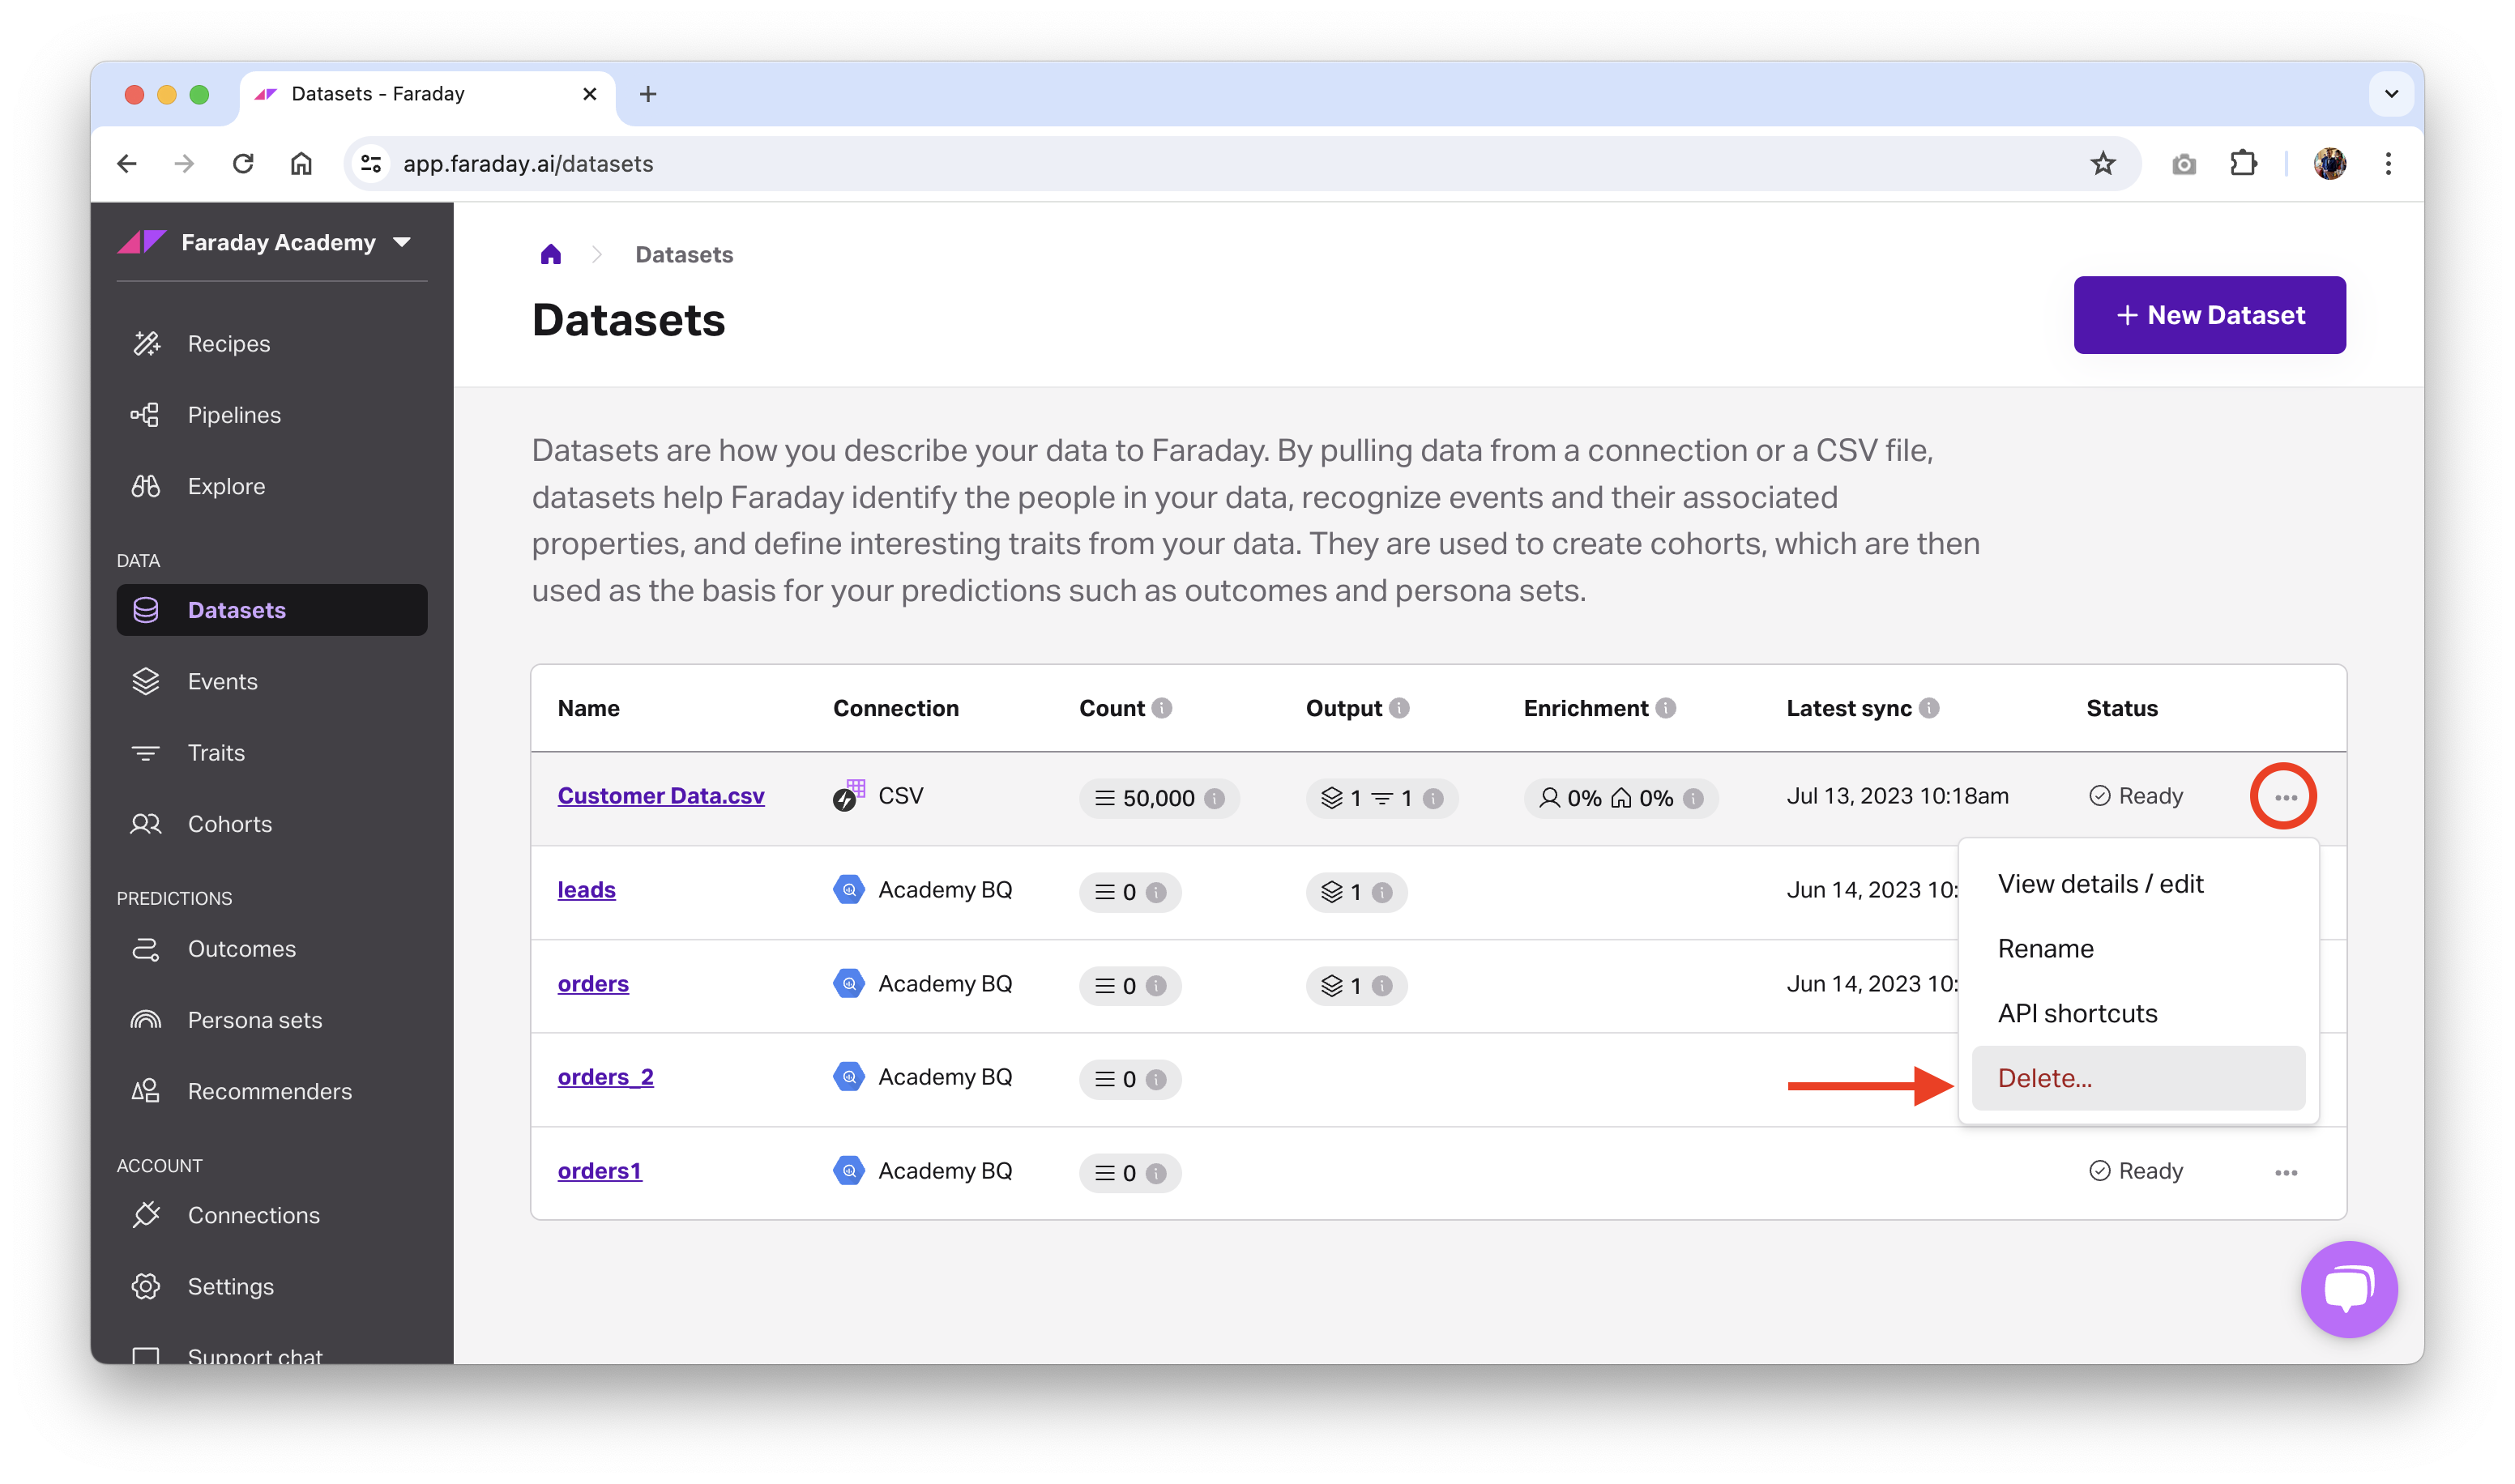
- API: use the delete dataset or archive dataset API requests.
📘Deleting and archiving resources
See object preservation for more info on deleting and archiving resources.
Data ingestion insights
Every time a dataset ingests data, Faraday records a detailed ingress log. These logs give you visibility into how your data moved through the ingestion pipeline — including how many rows were received, how many passed each processing stage, and how many were ultimately recognized and enrichable.
Viewing ingress logs
In the Dashboard, navigate to a dataset and open its ingress logs view. The most recent ingress event is shown by default with the matching waterfall already expanded. Click any log entry to see its full breakdown.
Understanding the matching waterfall
Each ingress log contains the following metrics:
| Metric | Description |
|---|---|
total_row_count | Total rows received in this ingestion |
processable_row_count | Rows that could be parsed |
valid_row_count | Rows passing validation (US-based records) |
allowed_row_count | Rows allowed after CCPA filtering |
allowed_row_unique_people_count | Unique people from allowed rows |
recognized_row_count | Rows matched to a known identity in the Faraday Identity Graph |
recognized_row_unique_people_count | Unique people from recognized rows |
enrichable_row_count | Rows eligible for enrichment |
enrichable_row_unique_people_count | Unique people from enrichable rows |
enrichable_residence_count | Residence-only records eligible for enrichment |
You can derive useful rates client-side — for example, recognized_row_count / allowed_row_count gives you your recognition rate.
API access
Ingress logs are available via the API:
GET /datasets/{dataset_id}/logs/ingress
Supports limit (default: 10, max: 100) and offset query parameters. Pagination metadata is returned in response headers per RFC 5988. See the API reference for the full schema.
Active predictions
The number of active predictions is the count of distinct objectives that are currently deployed via payloads in active pipelines.