Pipelines
Pipelines (scopes in the API) let you choose which predictions you want to deploy, who you want to make those predictions on, and where they should go.
Pipelines overview
Pipelines (referred to as scopes in the API) are how you choose which predictions you want to deploy, who you want to make those predictions on, and where they should go. When building one, you'll start with the population. Here, you'll choose which of your cohorts should be the population to include, or who you want to make predictions on. You can also optionally choose a population to exclude if you'd like to prevent a cohort from having predictions made.
Next, in the payload, you'll define the predictions you'd like to make:
-
Predictions: Score the population with outcomes, discover their persona sets to enable rich insights & personalization, and use recommenders to serve next-best offers.
- Available via the Dashboard or the API with the outcome_ids, persona_set_ids, and recommender_ids parameters in createscope or updatescope
-
Cohort membership: Membership indicators can help you determine if members of the pipeline's population are also a member of a specific cohort you've created.
- Available via the Dashboard or the API with the cohort_ids parameter in createscope or updatescope.
-
Traits: Adding traits to the payload will display trait values for individuals in the population, which can be useful to add additional context when analyzing and segmenting individuals.
- Available via the Dashboard or the API with the attributes parameter in createscope or updatescope.
-
Prediction explanations: Prediction explanations can be enabled to provide explanations for why any individual prediction was given. For documentation on a deployment's explanation output, see deployments.
- Available via the Dashboard or the API with explainability parameter in createscope or updatescope.
After your pipeline is created, you'll deploy your predictions by creating a deployment (referred to as a target in the API) so that your predictions can be delivered to any connection you've made to a database, data warehouse, cloud bucket, a Faraday-managed connection, or to a CSV file.
📘Preview mode
By default, a newly-created pipeline will be in preview mode. Preview mode indicates that the pipeline will only generate 1,000 rows of predictions, which can be used to see if the output is in the desired format. For the full prediction payload, disable preview mode, which requires a deployment to have been created. Disabling preview mode–via either the Dashboard UI or the preview parameter of the updatescope API request–will keep the pipeline up-to-date.
For pipeline creation instructions using both the Dashboard UI and API, see our how-to docs for use cases.
👍Key takeaway: pipelines
Pipelines are how you choose which predictions you want to deploy through the payload, who you want to make those predictions on through the population, and where they should go through the deployment target. Pipelines are customized through a combination of predictions (outcomes, persona sets, recommenders), and/or cohorts, and/or traits, and deploy to either a connection or a CSV file.
The Analysis tab
Every pipeline has an Analysis tab that surfaces insights about your scope's population and predictions — without requiring you to build a deployment first. The tab brings together five views:
- Efficacy — performance of Faraday's predictions versus what actually happened
- Counts — population size by state and zip code
- Pipeline diagnostics — checks that compare the pipeline's population against each prediction's eligible population
- Prediction distribution — how the scope is distributed across probability bins for each prediction
- Market opportunity analysis — projected outcome attainment across geographies
Most of these are also available via the API — see the scope efficacy, scope analysis, and market opportunity analysis endpoints.
Counts
Counts shows the size of your pipeline's population — both individuals and residences — broken down three ways:
- Total — overall individual and residence counts, including counts per payload cohort
- By state — individual and residence counts for each state in the population
- By zip code — individual and residence counts for each zip code (available when the population spans 250 or fewer zip codes)
Use this to understand your addressable population in a given market before defining a deployment.
Prediction distribution
For each outcome and recommender in the pipeline's payload, Prediction distribution shows how the scope population is distributed across probability bins compared to the eligible population used to create the outcome or recommender model, with cumulative individual and residence counts at each level. Use this to pick deployment cutoffs (e.g. "top 20% by predicted likelihood") before exporting.
Pipeline diagnostics
Each pipeline includes a diagnostics section that runs checks to help ensure that your pipelines are properly configured. These checks will look at both the population and payload of a pipeline, then compare them with the eligible population used in the predictions (outcomes or recommenders) themselves.
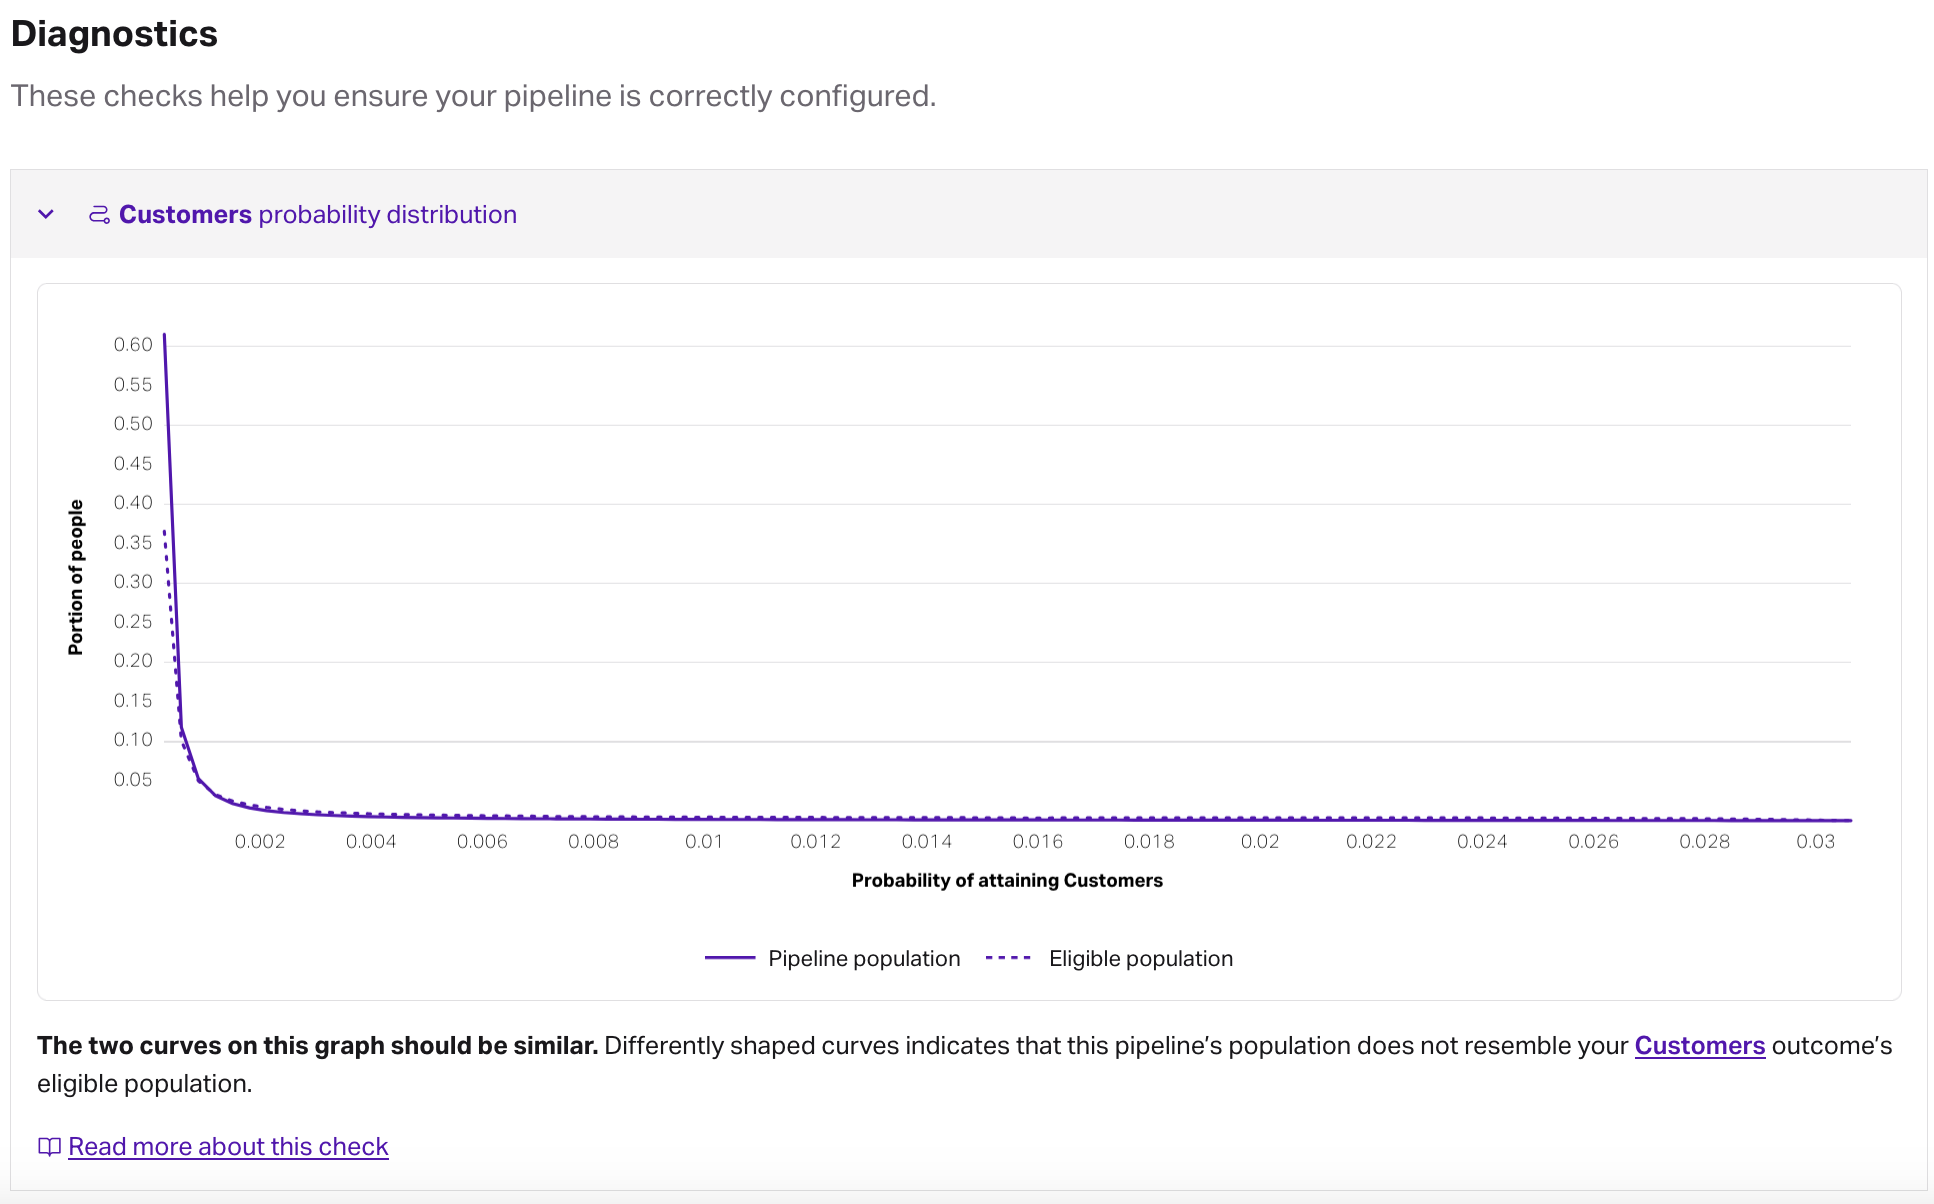
For a pipeline diagnostic to look normal, we’d want to see the two curves have similar shapes, which indicates that the data used in both the outcome and in the pipeline are similar. You wouldn’t create an outcome to predict how likely everyone in the state of Vermont is to convert, and then use that model to score a population from Texas, right? Similarly, you wouldn’t want to use data from 2020 to create an outcome, then use that outcome in a pipeline to predict how likely to convert your 2024 new subscribers are.
If you’re finding that a pipeline shows two curves that are dissimilar, it’s likely there’s a discrepancy between the people used to build the prediction and the people you’re trying to make predictions on. Take a look at the populations for each resource, and consider refreshing the appropriate resource.
Efficacy
An efficacy report allows you to measure the performance of Faraday’s predictions versus what actually happened. This report can help you assess whether or not your predictions are performing as expected, and if not, can indicate that something should be looked into.
🚧️Requires active connection
In order for an efficacy report to be effective, the pipeline and outcome you select should be built using data from an active connection to your data source. Without an active connection, Faraday will be unable to communicate with your data to verify outcome attainment over time, which will result in an incomplete report.
To create an efficacy report:
- Click the + report button.
- Select the pipeline that you want to report on.
- Select the outcome that the report should use. This list only displays outcomes that have an active connection.
- Click finish to complete the report.
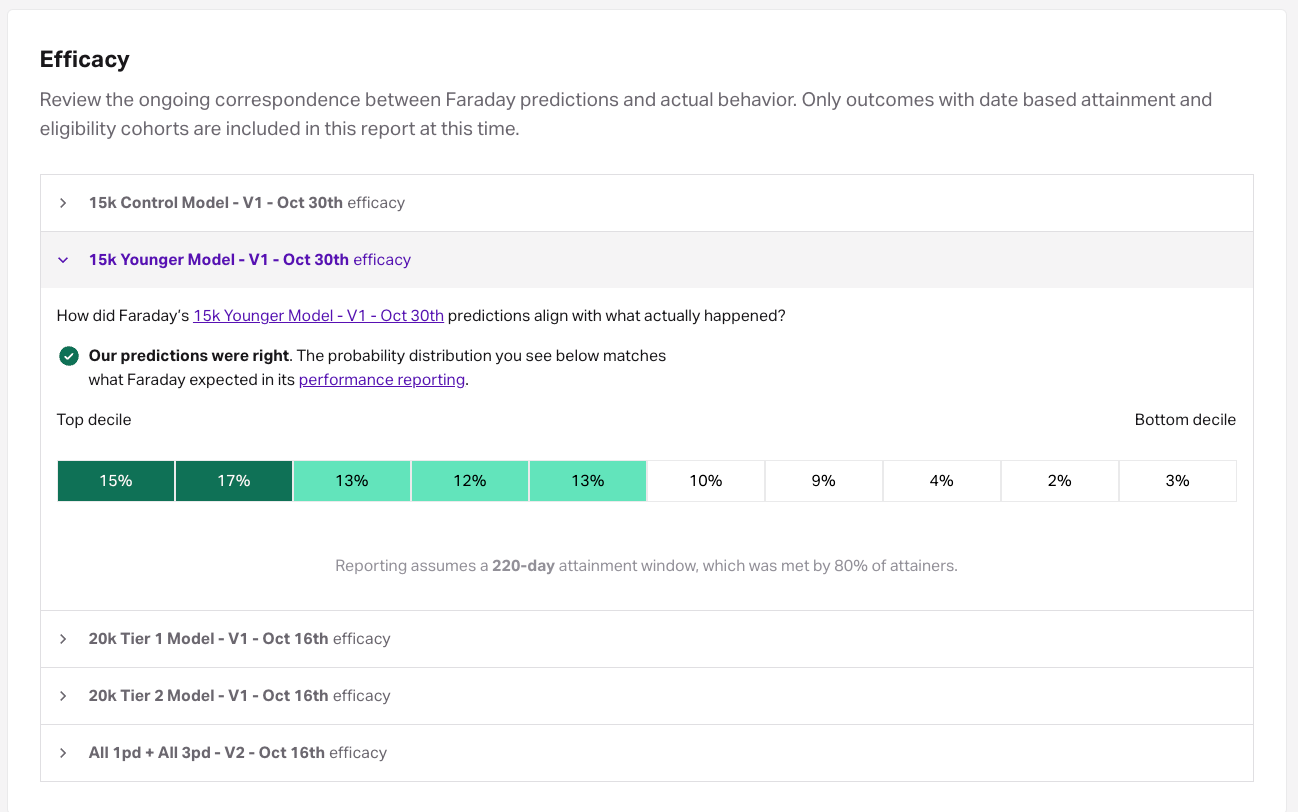
The report breaks down the outcome’s attainment per decile, which represents groups of individuals based on their predicted scores–for example, the top decile are the scorers that fall in the top 10% of scores. The percent value in each decile square indicates the percentage of individuals that attained the outcome in that decile.
Additional pipeline information
Preview mode
📘What happened to enabling?
In the past, a pipeline included an enabled toggle, where it could be toggled on to “enable” the pipeline’s full prediction payload. We felt that this misrepresented what was occurring behind-the-scenes when the toggle was used, so we’ve changed “enabled” to “preview mode.”
All pipelines begin in preview mode, which includes a limited number of rows. This can be used to test if the output is in the desired format. To deploy all rows, simply turn off preview mode once you’ve created a deployment in the pipeline.
Membership indicators
Membership indicators, or including cohorts in your payload, are useful for segmentation. For example, say you want to know who in your customer base has an income of greater than $100k. Your population to include for your pipeline would be your Customers cohort, and as part of your payload, you could then select a cohort of customers with an income of greater than $100k. As a result, anyone who is indicated as being in that $100k or greater cohort in your pipeline is a current customer with more than $100k in income.
Eligibility restrictions
If the outcome you select in your payload specified an eligibility cohort, your pipeline is not restricted by that same eligibility cohort. For example, if your outcome's eligibility cohort is Leads (e.g. in a lead scoring outcome), and your pipeline's population to include is Everyone, then everyone will be scored–not just your leads.
Population exclusion
Pipelines support two levels of population exclusion, both available under the Need to exclude/suppress? disclosure in the Pipeline population settings.
Exclude at individual level suppresses specific individuals from the population — for example, excluding existing customers from an acquisition pipeline.
Exclude at address level suppresses all individuals who share an address with anyone in the exclusion cohort. This is useful for direct mail pipelines where you want to prevent everyone at a previously-mailed address from appearing in a new deployment — not just the specific individual who was originally mailed.
Both controls accept one or more cohorts. Via the API, address-level exclusion is available on the create scope and update scope endpoints using the exclusion_address_level_cohort_ids parameter in the population object.
Deleting or archiving a pipeline
Before deleting a pipeline, ensure that any deployments have first been deleted. Once there are no deployments using the persona set, you can safely delete it.
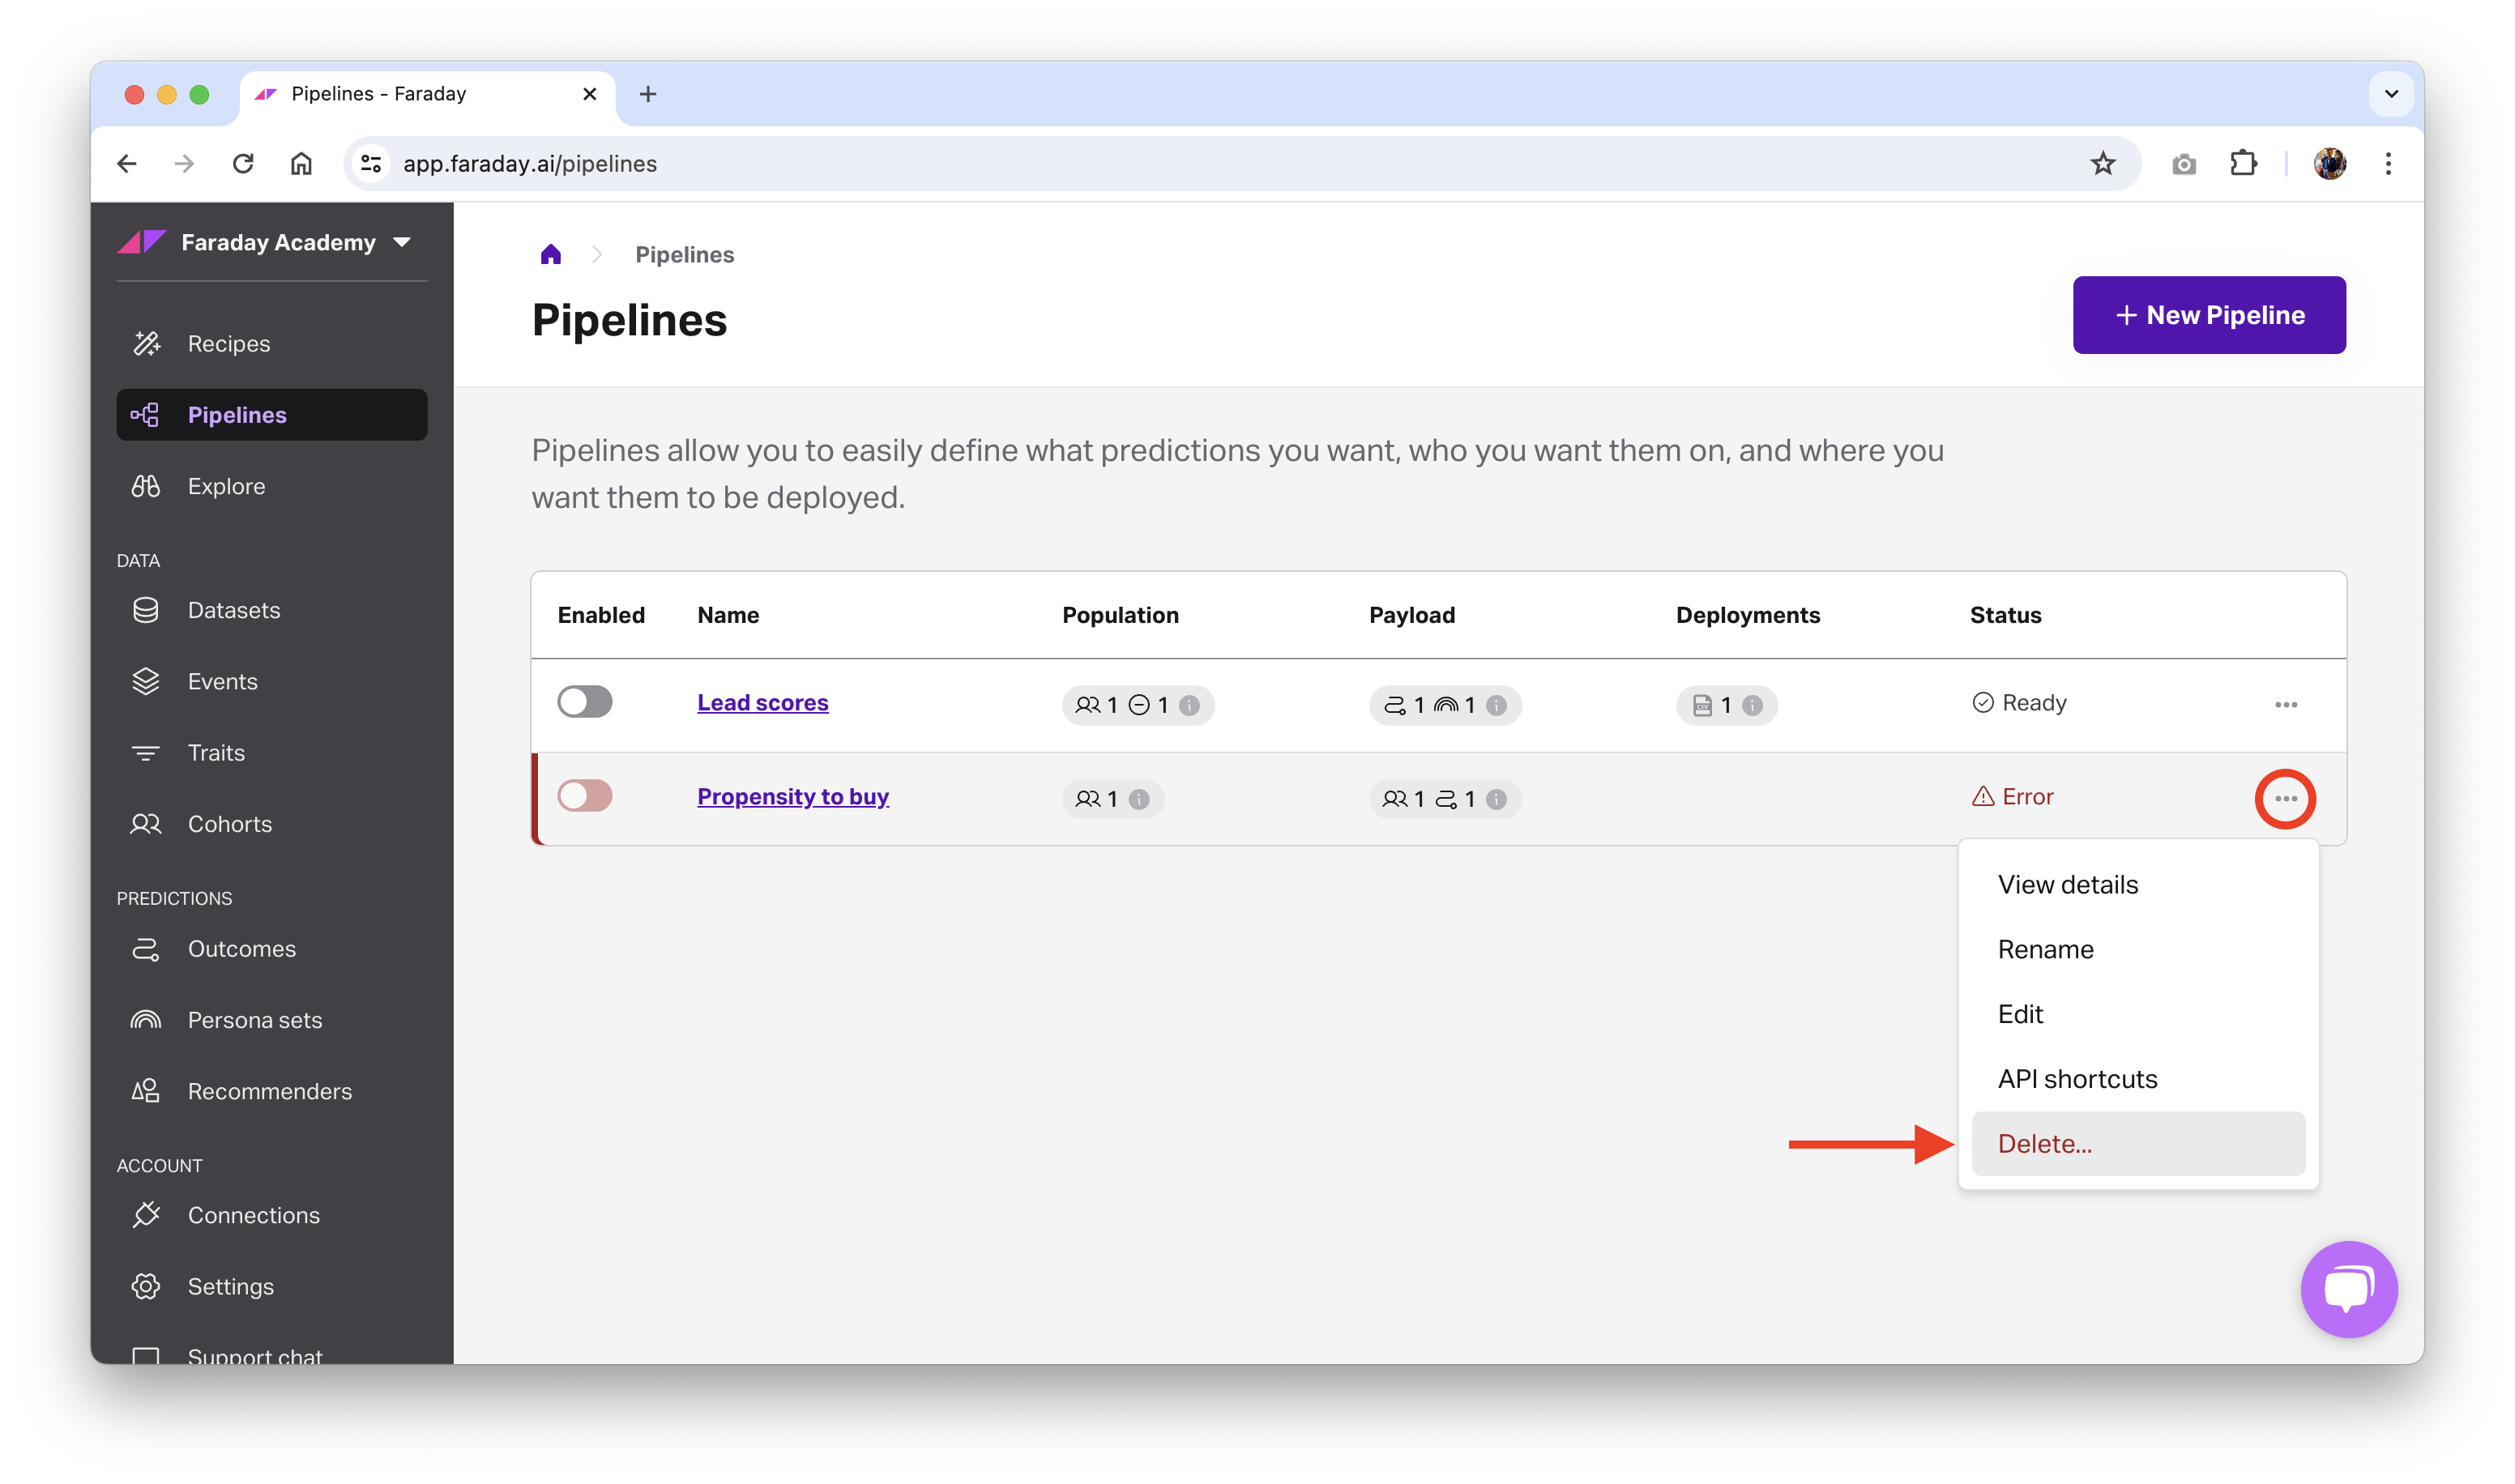
- Dashboard: click the ... menu on the far right of the pipeline you'd like to delete or archive (or upper right while viewing a specific one), then click the relevant option.
- API: use the delete scope or archive scope API request.
📘Deleting and archiving resources
See object preservation for more info on deleting and archiving resources.
Grow pipeline
A Grow pipeline is a type of pipeline whose population includes people that Faraday recognizes via the Faraday Identity Graph but who are not present in your first-party dataset. These individuals are matched based on shared characteristics with your known audience and are used to expand your reach—ideal for acquisition and prospecting strategies.